Download
1 / 5
50 likes | 223 Views
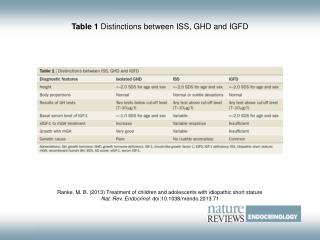
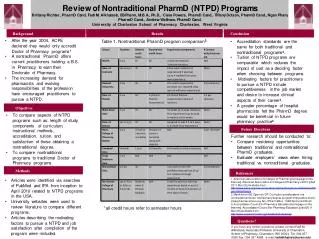
Table 1. Comparison between the provisional diagnosis based on the proforma versus final diagnosis Early arthritis 82 69 Rheumatoid arthritis 3 6 Psoriatic arthritis 5 5

E N D
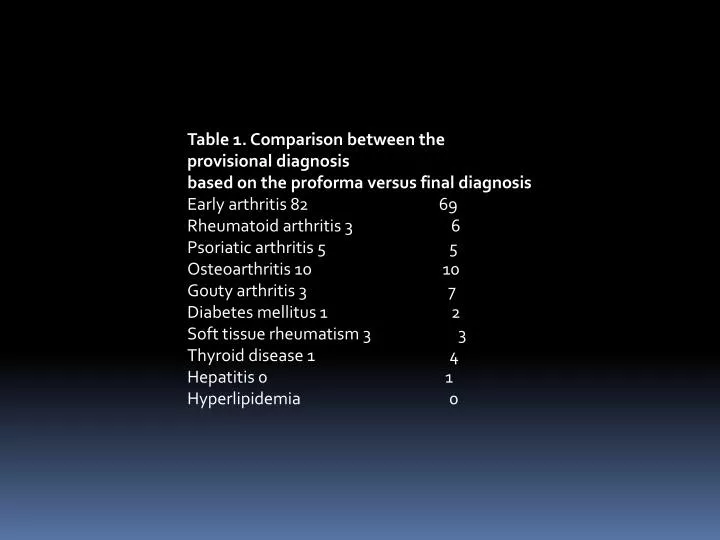
Table 1. Comparison between the provisional diagnosis based on the proforma versus final diagnosis Early arthritis 82 69 Rheumatoid arthritis 3 6 Psoriatic arthritis 5 5 Osteoarthritis 10 10 Gouty arthritis 3 7 Diabetes mellitus 1 2 Soft tissue rheumatism 3 3 Thyroid disease 1 4 Hepatitis 0 1 Hyperlipidemia 0
Table 2. Demographic data of all patients included in this study Number of patients assessed in the early arthritis clinic 108 Number of patients diagnosed as early arthritis 69 Female:male ratio 60:9 Mean age (years) 50.03 Disease duration (symptom-assessment) (mean) 6.1 months Referral lag time (GP-assessment) (mean) 3.4 weeks Number of patients on non-steroidal anti-inflammatory drugs 65/69 Number of patients on steroid therapy 4/69
Table 3. Clinical characteristics of the patients suffering from early arthritis assessed. Patients presenting with hand joint pain 67/69 (97.1%) Patients presenting with joint pain >3 joints 64/69 (92.8%) Symmetric arthritis 34/69 (49.3%) Positive compression test MCP joints 47/69 (68.1%) Positive compression test MTP joints 31/69 (44.9%) Duration of morning stiffness (mean) 44.35minutes Subcutaneous nodules 0/69 Baseline HAQ 0.831 Hand erosions by X-ray 0/69 Rheumatoid factor positive 25/69 (36.23%) ESR (mean) 23 mm/hour CRP (mean) 8.56mg/litre ESR = Erythrocyte sedimentation rate; CRP = C-reactive protein; HAQ = Health assessment questionnaire; MCP = Metacarpophalangeal; MTP = Metatarsophalangeal
Table 4. Correlation between the disease activity parameters in the patients with early arthritis MS CRP ESR PhGH PS PGH SJC TJC 0.831** 0.303* 0.305* 0.709** 0.623** 0.622* 0.358* SJC 0.132 0.156 0.278 0.360* 0.421* 0.415* PGH 0.562** 0.075 0.084 0.761** 0.975** PS 0.421** -0.082 0.066 0.734** PhGH 0.560** 0.245 0.280 ESR 0.141 0.332* CRP 0.133 **p<0.001; *p<0.05; MS = Morning stiffness; CRP = C-reactive protein; ESR = Erythrocyte sedimentation rate; PGH = Patient global health assessment; PhGH = Physician global health assessment; PS = Pain score; SJC = Swollen joint count; TJC = Tender joint count
The early arthritis clinic model helps to shorten the referral lag time as well as lag time to start disease-modifying antirheumaticdrug therapy.