Download
1 / 32
320 likes | 497 Views
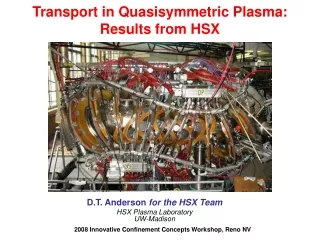
Plasma Flow Studies in the HSX Stellarator. S. P. Gerhardt, A. F. Almagri, D.T. Anderson, F. S. B. Anderson, J. Canik, W. Guttenfelder, J. N. Talmadge University of Wisconsin, Madison C. Deng University of California, Los Angeles. Main Results.

E N D
Plasma Flow Studies in the HSX Stellarator S. P. Gerhardt, A. F. Almagri, D.T. Anderson, F. S. B. Anderson, J. Canik, W. Guttenfelder, J. N. Talmadge University of Wisconsin, Madison C. Deng University of California, Los Angeles 2002 APS Meeting, Orlando, Florida
Main Results • We have developed a system of Mach probes, UV spectrometers, biased electrodes, and H detectors to study the physics of plasma flows and flow damping in HSX. • With electrode bias applied to the discharge, the turbulence is reduced, the edge Vf and Isat profiles steepen, and the particle transport improves. • The plasma flow damping rate is larger in the neoclassically degraded configuration compared to the quasi-symmetric configuration. • We have begun to improve the modeling of the neoclassical flow damping by introducing the full HSX geometry. • A Doppler spectroscopy system based on a 1-m grating spectrometer has been developed. • Preliminary measurements indicate larger unbiased plasma flows as the symmetry is broken, despite the increase in the damping rate. 2002 APS Meeting, Orlando, Florida
HSX Perspective on Plasma Flows • Tokamaks, STs, and RFPs have a direction of symmetry in which plasma flows easily occur. • These flows are often used for physics such as internal transport barrier manipulation. • Traditional stellarators have modulation of |B| in all directions on a flux surface. • This modulation leads to large parallel viscous damping of flows in all directionstraditional stellarator plasmas have trouble rotating. • The quasi-symmetric stellarator attempts to fix this problem by reintroducing a direction of symmetry into the system while still externally generating most or all of the rotational transform. • HSX is the worlds first and only quasi-symmetric stellarator, with a direction of quasi-symmetry along a helical path. 2002 APS Meeting, Orlando, Florida
Outline of this Poster • Description of diagnostics used in bias experiments. • Characteristics of biased discharges. • Measurement of plasma flows in HSX using a 6-tip Mach probe. • Calculations of neoclassical damping rates. • Initial measurements of impurity rotation by passive Doppler spectroscopy. 2002 APS Meeting, Orlando, Florida
antiMirror Mirror n=4, m=0 QHS n=4, m=1 n=4, m=1 n=4, m=0 n=4, m=1 Three Different Configurations of HSX Different Magnetic Field Spectra… But other properties are similar… 2002 APS Meeting, Orlando, Florida
Gas Puff An System of Absolutely Calibrated H Detectors has been Constructed. • 16 H detectors (9 in a single vertical plane and 7 in a toroidal array) view the plasma. • All detectors are absolutely calibrated using an integrating sphere light source. • Diagnostic built and calibrated with the help of John Canik. 2002 APS Meeting, Orlando, Florida
H in vertical cut Toroidal Distribution of H Line Density His used to calculate an average neutral density. • The total number of photons per second is estimated as: • Here, fT() represents the toroidal distribution and iis the line average brightness (photons/secm2) from the chords of the vertical array, and R is the spacing between chords. • The total number of particles in HSX is estimated as: • This leads to an estimate of the neutral density: • Here, JH=.1 is the number of ionizations per H photon from the Johnson and Hinnov1 modeling and <v>ionization is the rate coefficient for electron impact ionization. Neutral density of 1.5x1010 cm-3 for the data above. 2002 APS Meeting, Orlando, Florida
Probe has 6 tips facing outward, with boron nitride insulator separating them. Similar design to the “Gundestrup” probes used in TdeV2 and TEXT3. Biased to –180V with respect to the HSX vessel. 7th “proud” pin used as a swept probe or as a floating potential monitor. We use transformer coupled isolation amplifiers with 4 pole role off at 100kHz. Data is analyzed using the unmagnetized model of I. Hutchinson4. We can Measure Edge Flows Using a Multi-Tipped Mach Probe • In the model by Hutchinson, Isat vs. angle is represented as (Ku=.7 and Kd=.64): • For the Hutchinson model, the “calibration” factors, Ku and Kd are independent of Ti and Te. • X1 represents the magnitude of Isat, X2 is the approximate Mach number, and X3 is the angle of flow with respect to the probe. 2002 APS Meeting, Orlando, Florida
Raw Isat I`sat/ Isat Density Bias Electrode Voltage Biased Electrode Changes Transport Properties of the Discharge QHS Configuration • Bias pulse is accompanied by reduction in turbulent fluctuations. • The top plot visibly shows the reduction in Isat turbulence. • The relative fluctuation amplitude shown in second plot demonstrates a large dip during the bias duration. • Measured with amplifier with 100kHz bandwidth. • See poster by Guttenfelder, this session, for more information of turbulence studies in HSX. 2002 APS Meeting, Orlando, Florida
H signals Line Density Neutral Density Particle Confinement Time Window of Bias Electrode Pulse Factor of 1.4 Improvement in Particle Confinement with Bias. QHS Configuration • Shown at right are signals from a biased discharge. • Density and H data binned in .2ms windows to make the neutral density and particle confinement time calculation. • Particle confinement time goes from about 2.5ms to 3.5 ms, improvement factor of 3.5/2.5=1.4 • Wall reflections may cause us to overestimate the neutral density and source rate. • No steady state density reached with bias. The density will rise to ECH cutoff if allowed. 2002 APS Meeting, Orlando, Florida
Profiles Steepen With Biasing. • The edge floating potential and Isat contours show considerable steepening with bias. • The edge Isat profile steepens considerably, even dropping slightly at the edge. • Maximum gradient in Isat in region of largest potential gradient • Inverted density profile shows considerable edge steepening. Inverted Density Profile 2002 APS Meeting, Orlando, Florida
Density 6 Isat signals Bias Voltage H Flow Speed Density rises to ECH cutoff and stored energy falls. Stored Energy Plasma Flow Responds to the Bias Pulse • Plot Shows the evolution of a discharge with two bias pulses. • Acceleration of the plasma manifests itself in the separation of the 6 Mach probe signals. • Flow speed is shown with error envelope from fit routine. • Stored energy only crashes when density reaches ECH cutoff. QHS Configuration 2002 APS Meeting, Orlando, Florida
Plasma Flow Profile Responds to Bias QHS Configuration Isat profile • Same Isat and Vf profiles as the previous slide. • The plasma flow (X2) profile shows a jump in flow during bias for positions less than 5 cm from the wall. • Without bias, the flow speed gradually decreases as you move deeper into the plasma. • The flow direction with and without bias is similar for positions less than 5cm from the wall. • Immediate future work is to model these flow and potential profiles. Mach Number Flow Angle Vfloat Separatrix 2002 APS Meeting, Orlando, Florida
Can determine damping rate from rise and fall times or the change in speed : QHS: Mirror: Flow Damping Measurement Shows Faster Flow Damping in the QHS configuration. QHS Mirror 2002 APS Meeting, Orlando, Florida
Modified model of Coranado and Talmadge5 used to calculate damping rates. • Model solves the time dependent electron and ion continuity and momentum balance equations in the closure of no heat flow. • Damping mechanisms include linear parallel viscosity and ion-neutral collisions. • Parallel viscosity can be calculated in either the plateau or Pfirsch-Schlueter regime. • Plasma flows are incompressible in this model. • Calculations are done in the Hamada coordinate system…original paper used Hamada basis vectors for a large aspect ratio tokamak6 to convert to lab coordinates. 2002 APS Meeting, Orlando, Florida
We Use the Proper Hamada Spectra in the QHS and Mirror Configurations. • Hamada spectrum is calculated in a way similar to the Boozer spectrum. • Note that the spectrum is more dispersed in the Hamada case than the Boozer case. • Use up to 150 spectral components on the LCFS when estimating the damping rates. 2002 APS Meeting, Orlando, Florida
Tokamak Approximations Calculated HSX Working on Calculations of HSX Hamada Basis Vectors. • To correct the tokamak basis vectors, need to know B, B, <e·e>, < e ·e>, <e· e >, where and are the Hamada toroidal and poloidal angles (0<,<2) and <f> is the flux surface average of f. • Also need to know e, e, and V, at the location of the probe. • B, B can be calculated by simple field line following using the simple relationships: • Plot above shows that for the QHS configuration, the contravariant components of the field differ from the tokamak approximation by 20%. 2002 APS Meeting, Orlando, Florida
Hamada Basis Vectors Can be Calculated. • The three Hamada Coordinates satisfy the equations: • These are all of the form: • Now break f into three components in laboratory angle. • Using methods similar to Nemov, we can write three equations, one for each component of f: • Each of these equation can be solved along a field line as: 2002 APS Meeting, Orlando, Florida
This Method of Calculating the Basis Vectors depends on their Initial Conditions. • At the part where the field line integration starts, we need 3 components of each of 3 basis vectors (P, Q, G, P, Q, G, P, Q, and G). • Bad initial conditions will give non-periodic solutions to the 9 components of the basis vectors. • At the outboard midplane of the symmetry plane, we can say P=d/dR, Q=G= P= P=0. This leaves only four initial conditions unknown. • We have three conditions that must be met: • These three allow us to reduce the problem to a single variable. • We integrate approximately 100 transits around the machine for different values of this remaining variable, then evaluate the periodicity of the results. • This gives us a “Penalty function” which we can use in a minimization routine to pick the initial values. 2002 APS Meeting, Orlando, Florida
Example of the Hamada Basis Vectors for HSX • We show the components of and in a vertical cut at a symmetry plane. • The three components are plotted against both the lab and hamada poloidal angles in this plane. • 100 Toroidal transits used calculated, showing the good single valuedness of the solution. • With this calculation, we get • The Tokamak approximation gives: • These calculations represent possible factor of 2 corrections in the damping rates. 2002 APS Meeting, Orlando, Florida
Mirror Total Damping Rate Mirror Viscous Damping Rate Total QHS Damping Rate Charge Exchange Damping Rate QHS Viscous Damping Rate Approximate Location of Measurements Combining all this allows a calculation of the damping rates. • Damping Rate is calculated here as a function of radius for the QHS and Mirror configurations. • Still use tokamak approximation for <e·e>, < e ·e>, <e· e >. • Modeling shows that the QHS damping is dominated by neutral damping. • The Mirror configuration damping rate is determined by a combination of neutral damping and parallel viscous damping. • Model also predicts profiles of radial conductivity, plasma flow, electric field….these are areas of future investigation. 2002 APS Meeting, Orlando, Florida
Doppler Spectroscopy Using a 1-meter spectrometer. • ISA 1000-M monochrometer, with 3600 grooves/mm grating used for Doppler Spectroscopy. • 1024x256 element back-thinned CCD, with 26 micron square pixels. • Trifurcated fiber bundle, made from 3 1.5mm core diameter fused silica fibers, allows three simultaneous views of the plasma. • Spectrometer control done using labview. Data analysis done in Matlab. • System built on a self contained stand. • Discharges typically taken with approximately 20% Methane in the gas system. 2002 APS Meeting, Orlando, Florida
9 5 1 Poloidal and Toroidal Viewing Systems Approximate Line of Sight for Toroidal View 2002 APS Meeting, Orlando, Florida
Cd light source allows compensation of small misalignments. • 3 Fused silica fiber reflect Cd I light at 228.802nm off the collection lens and into the fiber. • Multiple exposures taken before and after each shot, for all regions of the CCD. • Pattern Matching done to determine the relative alignment of the three CCD regions. 2002 APS Meeting, Orlando, Florida
Initial Wavelength Calibration done assuming that chord 5 has no chord average rotation. • Plot at right shows the “efficiency” of the various chords for detecting flows. • Wavelength shifts are calculated assuming that the central chord is not rotating, and that the small shifts in the Cd I line position can be used to calibrate small alignment errors. • Shifted flux surfaces in non-QHS configurations of HSX could bring this calibration method into question. • Working to remove this constraint…need to understand the dispersion better. 2002 APS Meeting, Orlando, Florida
The Fits to the Spectra Work Well. • Fits of the CV line at 227.089nm. • These three spectra for a 10% antiMirror amplitude. • Fits done using a fit function7: • Note the large Doppler shift of the toroidal chord, flowing away from the detector. • Able to view CV at 227.089 nm and CIII at 229nm with the same exposure. Vertical Chord Central “Calibration” Chord Toroidal View 2002 APS Meeting, Orlando, Florida
Errors in Spectrometer can be Found by looking at Flows on Inboard and Outboard Side. • With central Chord (#5) as a reference, used other two fibers to measure flow along chords #4 and #6. • Between shots 62 and 63, the two fibers were switched. • Discharge conditions held constant. • Shows that when the fibers are interchanged, they exchange flow speeds. • Implies an 1km/s systematic error, either due to alignment problems or to non-zero line averaged flow along calibration chord. 2002 APS Meeting, Orlando, Florida
The antiMirror flow speed generally increases with density. • Density scan in antiMirror configuration shows increasing toroidal flow speed. • Core Poloidal rotation also shows increase in flow. • Don’t yet know how the CIII and CV are distributed across the minor radius. 2002 APS Meeting, Orlando, Florida
Smooth Transition in Toroidal Flow Speed from QHS to antiMirror. • Shown at right is an antiMirror amplitude scan at a density of 1x1012 cm-3. • As the amplitude of the symmetry breaking term is increased, the stored energy is reduced and the apparent toroidal rotation increases. • Are “Direct Loss Orbits” driving rotation? • Note: This data was taken with slightly wider entrance slit (300 microns instead of 200 microns) than previous plots. Broader instrument function leads to more points on the Gaussian. 2002 APS Meeting, Orlando, Florida
“Toroidal” Flow in the antiMirror configuration changes sign when the field is flipped. Two Similar Discharges with Opposite Fields. Reference View Toroidal View Flow Speeds of carbon ionization states. 2002 APS Meeting, Orlando, Florida
Carbon Accumulation Has Made it Difficult to Measure the CV Brightness and Poloidal Flow Profile. • 18 discharges with constant density taken. • Fiber #2 kept on central chord of array, while other 2 fibers were moved around. • CV brightness continuously increased at fix density. • Appears that the Carbon is accumulating in the vessel between shots. • Can be removed by glow discharge, but between shot glow is difficult for the HSX glow system. 2002 APS Meeting, Orlando, Florida
Results • It is possible to improve particle transport in HSX using a biased electrode. • The plasma flow damping rates have been measured in different configurations, showing that the flow damping rate is much lower in the QHS configuration. • We are in the process of improving the modeling of the damping rates and profiles. • Preliminary results from a Doppler spectroscopy system show “toroidal” flow. [1] L.C. Johnson, E.J. Hinnov, Quant. Spectrosc. Radiat. Transfer 13, 133 (1973) [2] C. MacLatchy et. al., Rev. Sci. Instrum. 63, 3923 (1992) [3] R. Back and R. Bengtson, Rev. Sci. Instrum. 68, 377 (1997) [4] I. H. Hutchinson, Plasma Phys. Control. Fusion 44, 1953 (2002) [5] M. Coronado., J.N. Talmadge, Phys. Fluids B 5, 1200 (1993). [6] M. Coronado., J. Galindo Trejo., Phys. Fluids B 2, 530 (1990) [7] V. V. Nemov, Nuclear Fusion 28, 1727 (1988) [8] R. Bell et. al., Rev. Sci. Instrum. 70, 821 (1999) 2002 APS Meeting, Orlando, Florida