Download
1 / 13
130 likes | 225 Views
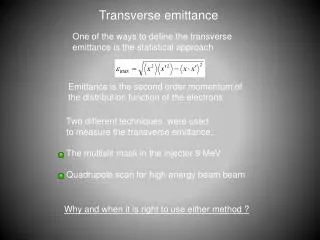
Analyzing beam line data to generate the emittance-momentum matrix, exploring TOF performance, reconstruction procedures, and Monte Carlo simulations for accurate momentum measurement.

E N D
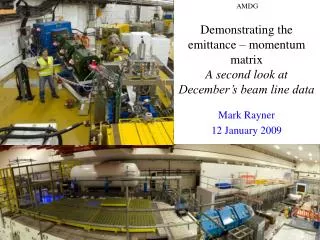
AMDG Demonstrating the emittance – momentum matrixA second look at December’s beam line data Mark Rayner 12 January 2009 MICE analysis meeting – BL analysis
Introduction – The MICE beam line Initial 4D eN (mm) 3 6 10 Absorber Pz (MeV/c) 140 Data 200 240 D1 D2 Cooling channel and spectrometers Q1 Q2 Q3 Q4 Q5 Q6 Q7 Q8 Q9 DK sol Target TOF0 TOF1 Diffuser • Purpose: generate the elements of the “emittance-momentum matrix” • Study performance at every portion of a full cooling channel • Can we use the TOFs to demonstrate the matrix elements? MICE note 176 Apollonio, Cobb MICE analysis meeting – BL analysis
Timing detectors TOF0 and TOF1 0.48 m 0.48 m 7 x 6cm scintillator bars sx = 1.73 cm st = 50 ps 10 x 4cm scintillator bars sx = 1.15 cm st = 50 ps Tof-0 Tof-1 MICE analysis meeting – BL analysis
Beam characterization using the TOFs at TOF1 at the diffuser phase ellipse orientation phase ellipse orientation longitudinal momentum emittance emittance path length trans mom beam size z g0 PID MICE analysis meeting – BL analysis
PID on December’s scaled pm decay beam line data Kevin’s optics 6-200 Runs 1380-1397 and 1391-1393 Intermediate momentum beam line with scaled quad currents Runs 1407-1408 6-140 (rescaled currents) Runs 1409-1411 MICE analysis meeting – BL analysis
Reconstruction procedure • Iterative calculation of increasingly good s=Dz+d and P • Begin with P from P/E=Dz/t • 1 Calculate a linear transfer map at P from TOF0 to TOF1 (top hat quadrupoles) • 2 Deduce x0’ and y0’ from x1 and y1 • 3 Integrate ds while tracking the initial trace space vector through the beam line • 4 Make a better estimate of P from P/E=s/t • 5 Make a small Bethe-Bloch correction for the energy loss in air between the TOFs Marco’s=6mm pabsorber=200 MeV/c centre of the e-p matrix beam MICE analysis meeting – BL analysis
6-200 momentum reconstruction Det. resp. Dt (blue) looks surprisingly good compared to the truth (light blue), but there is indeed a 70 ps error MC truth (and hence the reconstructed detector response of the truth) and data have slightly different geometries and optics, but both have been designed by Marco to generate the 6-200 element of the e-p matrix Momentum is reconstructed just before TOF1 The simulation contains only muons Slide 5 shows show the data cut on Dt to select muons Old geometry (May 2009, simulation) Dz = 796.61 cm New geometry (December 2009, data) Dz = 779.91 cm Difference = 16.7 cm = 0.557 ns / c MICE analysis meeting – BL analysis
x and y trace space Truth Recon’d det. sim. Data MICE analysis meeting – BL analysis
(Raw) RMS trace emittances from the 2D histograms Binned truth x RMS trace emittance = 2.367800 mm y RMS trace emittance = 1.453120 mm Transverse 4d RMS trace emittance = 1.854912 mm Reconstruction of detector response simulation x RMS trace emittance = 2.552532 mm y RMS trace emittance = 1.123380 mm Transverse 4d RMS trace emittance = 1.693359 mm Data x RMS trace emittance = 2.309358 mm y RMS trace emittance = 0.933133 mm Transverse 4d RMS trace emittance = 1.467971 mm MICE analysis meeting – BL analysis
Extra slides MICE analysis meeting – BL analysis
Momentum measurement by the TOFs Muon energy approximately constant between TOFs p/E = s/t s = path length between TOF0 and TOF1 (~8m) t = time of flight (~29ns at 250 MeV/c) Predicted resolution 4.7 MeV/c at 250 MeV/c Bias on the measurement Time of flight mis-calibration by 10 ps: 0.57 MeV/c bias Path length over/underestimation by 10 mm: 2.1 MeV/c bias Positron calibration is necessary s - L (mm) px (MeV/c) x (mm) s - L (mm) py (MeV/c) y (mm) MICE analysis meeting – BL analysis
Monte Carlo simulation • P/E=s/t where s=true path length • Measures true p before TOF1 with RMS error 0.65 MeV/c • See right histogram • Width and bias due to dE/dx in the air between TOF0 and TOF1 Marco’s=6mm pabsorber=200 MeV/c centre of the e-p matrix beam MICE analysis meeting – BL analysis
Should we simply approximate s=Dz? • P/E=Dz/t • RMS error 3.38 MeV/c • Bias -4.06 MeV/c • Due to the width of the d=s-Dz distribution Marco’s=6mm pabsorber=200 MeV/c centre of the e-p matrix beam MICE analysis meeting – BL analysis