Download

1 / 57
570 likes | 722 Views
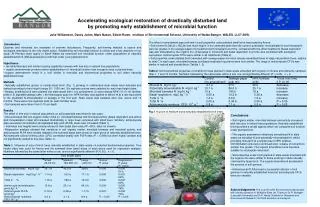
Utilization of Biosolids for Disturbed Land Rehabilitation. W. Lee Daniels and Greg Evanylo. http://www.landrehab.org. A Better Title for Most of This!. How I spent my winters chasing nitrates around the Coastal Plain. History and Background.

E N D
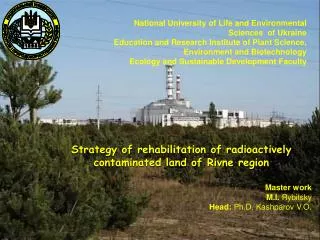
Utilization of Biosolids for Disturbed Land Rehabilitation W. Lee Daniels and Greg Evanylo http://www.landrehab.org
A Better Title for Most of This! How I spent my winters chasing nitrates around the Coastal Plain.
History and Background • Biosolids have been used at higher than agronomic rates on coal mined lands in the Appalachians since the 1970’s. Bill Sopper (Penn State) pioneered the practice with assistance from Bob Bastian (EPA) and others. • Early coal mined land research at Penn State and Va Tech (Haering et al. 2000) has confirmed the benefits of this practice and indicated a general lack of ground- and surface-water impacts.
Controlled Overburden Placement (COP) plots ready for seeding in April, 1982 Surface treatment experiment; biosolids applied at 10, 25, 50 and 100 T/ac vs. topsoil and sawdust plots
Results in Roberts et al. 1988 abc; Nash, 2012. COP in early June, 1982, after seeding and rainfall.
2008 Analysis – COP Experiment • Field Sampling • Biomass and Litter • Soil 0-5 cm 5-25 cm • Physical Properties • Rock Fragments, PSA, Texture • Chemical Properties • pH and EC • Iron Oxides and Extractable P • Exchangeable Cations and CEC • Macro and Micronutrients • Soil Organic Matter • Total Soil Nitrogen • Total Soil Carbon • Organic C and Carbonate • Stats • Fisher’s LSD • Paired T-test • Regression • Long Term Comparisons 2:1 SS:SiS prior to sampling in 2008.
SA- 2008 Extractable P Note: Increases in Cu and Zn uptake by fescue occurred, but were below forage levels of concern. No other non-nutrient metals (e.g. Pb) showed a loading rate effect.
Large-Scale Application of Biosolids plus Woodchips @ 160 T/Ac on Rocky Spoils in 1989 At these loading rates, you add > 3000 kg per ha total N and > 1000 kg per ha total P
Over a five-year period, a 300 acre application of 65 T/ac of biosolids + woodchips (C:N = 30) had no effect on ground water NO3 or metal levels. In fact, NO3 levels were highest before application due to the use of NH4NO3 explosives! Results in Haering et al. 2000
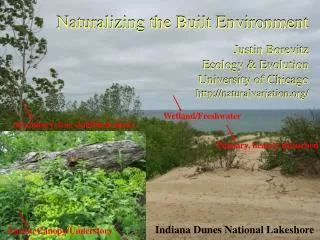
Powell River Project area 10 years after application with biosolids.
19-year old mine soil that received biosolids treatment in 1989. A horizon is 5 inches thick and exhibits well developed granular structure.
Mine soil pedon 15 feet away from previous soil that did not receive biosolids.
History and Background In 1995, the State of Virginia Dept. of Mines, Minerals, and Energy developed guidelines for the application of biosolids to coal mined lands (VDMME, 1995) with Virginia Tech’s assistance. These guidelines capped loading rates at 35 T/Ac (dry) for biosolids cake and at 50 T/Ac when the C:N ratio of the applied product was 25:1 or greater.
History and Background Application of higher than agronomic rates of biosolids to very gravelly and coarse-textured mine soils with shallow ground water regimes within the Chesapeake Bay watershed raised significant regulatory concerns with regard to long-term effects on nutrient loadings to ground water
Shirley Plantation Experiment At Shirley, we evaluated a range of biosolids loading rates (1x to 7x) agronomic rate of 14 Mg/hawith and without added sawdust (to adjust the applied C:N ratio to approximately 20:1) on a reclaimed gravel mined soil between 1996 and 1999.The mine soils utilized had been reclaimed for ten years and were in rowcrop production.
Land application of municipal biosolids to large experimental plots at Shirley in April 1996.
Results in Schmidt et al. (2001) & Daniels et al. (2003) Biosolids cake (C:N = 8) land-applied on gravel mine at 42 Mg/ha.
Wheat response to biosolids on unmined control plots at Shirley Plantation one year after application.
140 120 Nitrate Nitrogen (ppm) 100 80 60 40 20 0 09/20/96 11/21/96 02/27/97 01/14/98 04/15/98 Date Measured Figure 1. Shirley Plantation Lysimeters:Biosolids No Fert Fert 1.0x biosolids 3.0x biosolids 5.0x biosolids 7.0x biosolids
140 120 Nitrate Nitrogen (ppm) 100 80 60 40 20 0 09/20/96 11/21/96 02/27/97 01/14/98 04/15/98 Date Measured Figure 2. Shirley Plantation Lysimeters:Biosolids + Sawdust No Fert Fert 1.0x bio+sd 3.0x bio+sd 5.0x bio+sd 7.0x bio+sd
Nitrate-N leached over two seasons without sawdust added: Treatment Total-N Applied NO3-N Lost % App. ---------------- kg/ha ------------------- Control 0 5.9 c N.A. Fertilized 269 7.6 2.8 1X Biosolids 626 19.2 3.1 3X Biosolids 1252 37.4 3.0 5X Biosolids 3130 28.2 0.9 7X Biosolids 4382 59.8 1.4
Nitrate-N leached over two seasons with sawdust added: Treatment Total-N Applied Nitrate-N Lost % App. ---------------- kg/ha ------------------- Control 0 5.9 c N.A. Fertilized 269 7.6 2.8 1X + Sawdust 626 4.9 0.8 3X + Sawdust 1252 7.6 0.6 5X + Sawdust 3130 58.4 1.9 7X + Sawdust 4382 31.9 0.7
Findings at Shirley • Root zone leachates (@ 75 cm) showed enhanced nitrate-N leaching potentials the first winter after biosolids application that were directly related to loading rate and C:N ratio. • Treatment effects were only noted the first winter after a spring application. • Four adjacent shallow ground-water wells showed no effects of the loadings.
Mattaponi R. Adjacent Agricultural Fields
Site Description • Aylett Sand & Gravel mined in eastern King William County, Virginia (N37o 50.1' W77o 7.6'), immediately adjacent to the Mattaponi River. • Mined approximately 5 m of the Late Pleistocene sand and gravel unit (Tabb Formation)
Aylett Sand & Gravel Mine in October 1998 Results in Daniels et al. (2002)
Western portion of site in April of 1999 following fall 1998 application of mixed PVSC and Blue Plains biosolids at 78 and 34 Mg/ha, respectively.
Overall Hydrology and Water Quality • Groundwater flows from agricultural fields bounding the eastern portion of the site, under the site, and towards the Mattaponi River. • Groundwater discharge into the ponds and springs on-site is notable, particularly in the winter and spring.
Overall estimated ground-water flow regime for Sept., 1999. Flow paths in the spring were similar. Heads in m AMSL
Overall Hydrology and Water Quality Results • No treatment effects were seen on ammonium levels, and EC results mirrored nitrate-N levels, so we will focus on the nitrate-N data sets • Significant nitrate-N appears to be entering the site via ground-water flow from the upgradient agricultural fields
Overall Hydrology and Water Quality Results • Of the 11 well clusters installed within the treated area boundary, only three showed significant NO3-N elevations, even though the vast majority of them were either directly under or downgradient from biosolids treated areas • Nitrate-N levels in two wells (SW 1 and 3) directly adjacent/downgradient to areas receiving the 3X biosolids slowly increased in the fall of 1999, peaked around 40 to 50 mg/L in late winter/early spring of 2000 (Fig. 5), dropped under (10 mg/L) by May 2000, and remained < 2 mg/L through the winter of 2001.
Overall Conclusions • The long-term ground water monitoring data for this site also appear to indicate that the background addition of NO3-N from offsite agricultural sources is significantly greater over time than any short-term effects from reclamation related biosolids utilization
Mineral sands mining in VA and NC will disturb > 3000 ha; much will be prime farmlands
Iluka Resources Project • Large (> 2000 Ac) mineral sands mining operation in upper Coastal Plain. • Lime-stabilized biosolids were applied to 20 Acre mining pit reclaimed without topsoil in August of 2002. Loading rate was 35 T/Ac. • Water quality monitored monthly at 6 groundwater wells and 2 surface water discharge points for 10+ years.
Topsoil strip after grading and disking in April 2005. Results in Orndorff et al. 2011. 35 T/Ac Biosolids
2005 Corn Yields (bu/ac) Topsoil/Lime/NPK 61 c* Tails + Biosolids: 174 a Tails + Lime + NPK: 136 b Unmined adjacent: 224 County Average: 98 (2000 – 2005) Adjacent prime farmland – Orangeburg Soil with same management as plot area. *Yields within experiment followed by different letters were different at p > 0.01
Topsoil yields were reduced by compaction and heavy crusting. Are these “problems” typical of the topsoil replacement process?