Download
1 / 5
50 likes | 198 Views
Business Intelligence or Business Analytics Tools such as PanBI help making informed decisions. Data can drive people crazy, it makes it an inhibitive process when you know you have so much data lying around, but have no clue how to get insights from it in a meaningful way. <br><br>* Data Visualization <br>* CPG Dashboards <br>* BI Dashboards <br>* Hospitality Dashboards <br>* Grant Management Dashboards <br>* Excel Integration Pivot<br>

E N D
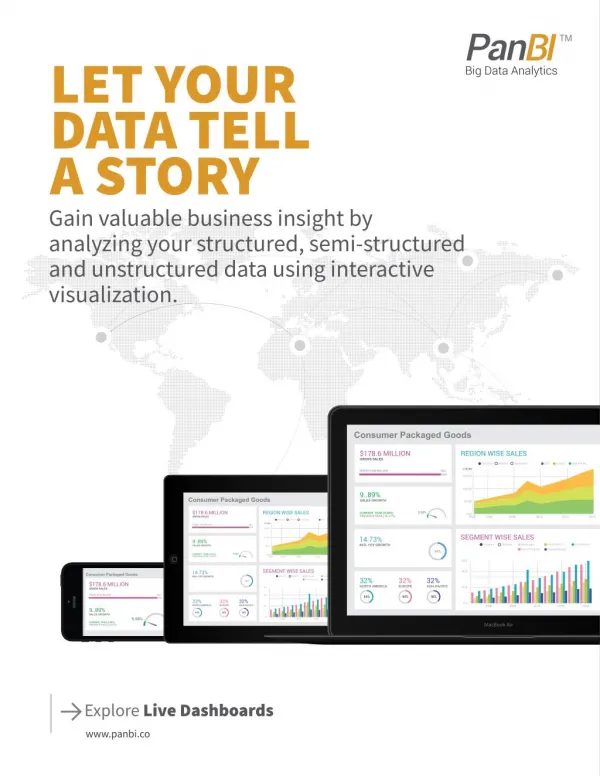
LET YOUR DATA TELL A STORY Gain valuable business insight by analyzing your structured, semi-structured and unstructured data using interactive visualization. Consumer Packaged Goods $178.6 MILLION GROSS SALES REGION WISE SALES Stacked Stream Expanded USA Europe Asia Pacific 178.60 TARGET $186 MILLION 95% 150.00 100.00 9..89% SALES GROWTH Consumer Packaged Goods 50.00 $178.6 MILLION GROSS SALES REGION WISE SALES 9.98% CURRENT YEAR (9.98%) PREVIOUS YEAR (16.37%) 0.00 2005 2006 2008 2010 2012 2014 Stacked Stream Expanded USA Europe Asia Pacific 178.60 TARGET $186 MILLION 95% 150.00 SEGMENT WISE SALES 14.73% AVG. YOY GROWTH 100.00 9..89% SALES GROWTH Grouped Condiments Grains/Cereals Confections Stacked Beverages Dairy Products 50.00 44% 9.98% CURRENT YEAR (9.98%) PREVIOUS YEAR (16.37%) 0.00 2005 2006 2008 2010 2012 2014 53.5 SEGMENT WISE SALES 14.73% AVG. YOY GROWTH 40.5 Consumer Packaged Goods Grouped Condiments Grains/Cereals Confections Stacked Beverages Dairy Products 32% NORTH AMERICA 32% EUROPE 32% ASIA PACIFIC 44% $178.6 MILLION GROSS SALES 20.5 53.5 TARGET $186 MILLION 40.5 95% 44% 44% 36% 32% NORTH AMERICA 32% EUROPE 32% ASIA PACIFIC 0.0 2006 2008 2010 2012 2014 20.5 9..89% SALES GROWTH 44% 44% 36% 0.0 9.98% 2006 2008 2010 2012 2014 CURRENT YEAR (9.98%) PREVIOUS YEAR (16.37%) MacBook Air ExploreLive Dashboards www.panbi.co
2/5 UNWRAP THE POWER OF YOUR DATA AND VISUALIZE ANYWHERE Helps transform your business by securely delivering engaging, touch-optimized and rich analytic experience. Catalog Organize and retrieve collections by user preferences and permissions Dashboards Interactive dashboards that provide rich insight to your data Visualize Dynamically build visually appealing informative charts and maps Personalize See what you want to see using personalized dashboards Collaborate Add comments against datasets and share for public view or private use Analyze Analyze historical and transactional data into business intelligence PanBI greatly enhances not only data comprehension, but it allows for a greater coverage of trends and patterns within structured & unstructured data. www.panbi.co
3/5 CONNECT REAL-TIME DATA FROM EXTERNAL DATA STORE Excel RDBMS Google Analytics SharePoint HDFS HDInsight Drupal MongoDB OData Socrata HIGHLIGHTS Collaborate & Share Modular & Scalable 1 5 Configurable & Interlinked Multilingual Support 2 6 Extensive Search & Filtering Responsive Design 3 7 Advanced Analytics Robust Security 4 8 Bring actionable insights to surface Discover visual insights in seconds Drive decisions using data Combine multiple views into interactive dashboards www.panbi.co
5/5 KEY CLIENTS IBRD - IDA United Nations Economic Commission for Africa NEPAD TRANSFORMING AFRICA www.panbi.co
4/5 Get a big picture of your data, become a BI Expert in no time. Start Your Insightful Journey With PanBI ExploreLive Dashboards Corporate Headquarters: USA 22866 Shaw Road Sterling, VA 20166 Phone: 703-230-3100 Fax: 703-230-3100 Support Location: INDIA II-138, Thaikkattukara P.O. Muttam, Aluva - 683 106 Kochi, India Phone: 484-2628803 / 06 / 09 An ISO 27001Certified Company www.panbi.co