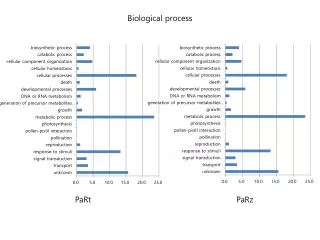
biological process
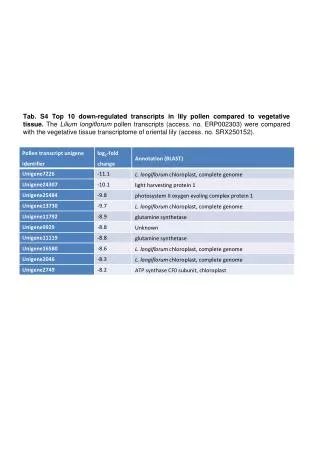
Tab. S4 Top 10 down-regulated transcripts in lily pollen compared to vegetative tissue. The Lilium longiflorum pollen transcripts (access. no. ERP002303) were compared with the vegetative tissue transcriptome of oriental lily (access. no. SRX250152). biological process. molecular function.

biological process
E N D
Presentation Transcript
Tab. S4 Top 10 down-regulated transcripts in lily pollen compared to vegetative tissue. The Liliumlongiflorum pollen transcripts (access. no. ERP002303) were compared with the vegetative tissue transcriptome of oriental lily (access. no. SRX250152).
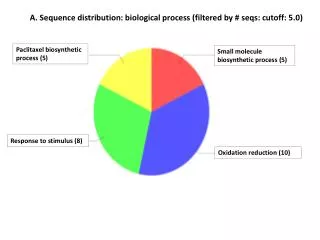
biologicalprocess molecularfunction cellularcomponent Fig.S1 Classification of the lily pollen transcriptome to GO classes. Sequences were classified to groups of the GO (Gene Ontology) data base.The number of identified sequences (number of genes) for each class is given in logarithmic scale.
Fig.S2Organizationoflilypollensequencesintofunctionalcategories (bin classes) usingthe Mercator software.
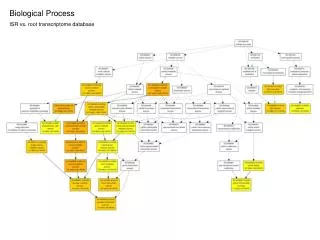
A B C Fig.S3 Classificationofthetranscriptometomayormetabolicpathwaysby MAPMAN.Each box presents an unigenewhich was classifiedintothegivenpathwaycategories. A.Liliumpollentranscriptomedata. B.Transcriptomedataobtainedfrom 6 different Liliumoriental hybrid tissues (Du et al., 2014). Grey dots: BIN classseswithoutanyidentifiedunigeneorgeneC.Up- (green) and down-regulated (red) lilypollentranscriptscomparedwiththetranscriptnumbersofLiliumoriental hybrid tissue. Data from Tab. S3 wereusedtoconstruct Fig. S3C.
PATHWAYS MAPPINGS EXPERIMENTS Fig. S4 How to visualize your own pollen transcriptome with MAPMAN. The appropriate data and pathways are given as packed files (lilyPollenRNAseq_supplements_Lang_etal_2014.zip) and should be unpacked and copied into the indicated directories of the MAPMAN software.
Fig. S5 Comparisonbetweenpollensequencesandsporophytictissuesequences / Amborellagenome. The percentageofidentifiedArabidopsispollen genes from Loraine et al. (2013, orange), thepercentageofidentifiedunigenesofthepresentstudy (Liliumpollen, Lang et al., darkred), theAmborella CDSs (olivegreen), Liliumoriental hybrid tissue (Du et al., green) andLiliumlongiflorumleaftissue (Shahin et al., 2012, blue-green) werecompared. The percentagesofidentified genes werecalculatedforeach MAPMAN Bin class 1 to 34.
A C B D E Fig. S6 MA plotsofcomparisonbetweenpollenunigenesandtranscriptsofthe vegetative tissuepool. A. MA plotofLiliumpollen versus Liliumoriental hybrid tissue (L-6Tis). The log2foldchangeisplottedagainstthe log2oftheaverageexpression. Accordingtotheassumptionthatundermost experimental conditionsthebulkof genes of an organismare not respondingdifferentially, thecloudofpointscentersaround a log2foldchangeof 0 (blackdots). Reddotsindicatepollenunigeneswithestimatedchanges in expressionlevel (P < 0.01) . B. and C. The middlepanelshowssimilarplots but pollenand L-6Tis readsweremappedtotherespectiveunigenes(B) , ormappedtotheunigenesandlengthdifferenceswerecorrected(C). D. and E.Finally, thelowerpanelshowstheplotsfortheanalysisLiliumpollen versus the 454 readdatasetof Shahin et al. (2012) usingonceagaintheirunigeneswithoutcorrectingforlength(D)andwith a unigenelengthcorrection(E). For (B)-(E) a trendline was addedforillustration
Fig. S7 Molecular phylogenetic analysis of plasma membrane H+ ATPase sequences from Lilium pollen and sporophyticLilium tissue using maximum likelihood method. Assembled amino acid sequences with homologies to P-type PM H+ATPases were aligned with MUSCLE and a phylogenetic tree was generated using Mega 6 software [3]. Sequences from pollen transcripts (L-pollen), leaf transcripts (L-leaf) and from pooled tissue (L-6Tis) were compared. The full-length ORFs of the pollen PM H+ATPases LilHA1 (AY029190) and LilHA2 (EF397610.2) were included which clustered only with pollen transcripts (red circle). The following settings were used for generation of the phylogenetic tree: Maximum Likelihood method based on the Poisson correction model [1]. The bootstrap consensus tree inferred from 500 replicates [2] is taken to represent the evolutionary history of the sequences analyzed [2]. Branches corresponding to partitions reproduced in less than 50% bootstrap replicates are collapsed. Initial tree(s) for the heuristic search were obtained automatically by applying Neighbor-Join and BioNJ algorithms to a matrix of pairwise distances estimated using a JTT model, and then selecting the topology with superior log likelihood value. The analysis involved 23 amino acid sequences. There were a total of 1042 positions in the final dataset. Evolutionary analyses were conducted in MEGA6 [3]. 1. Zuckerkandl E. and Pauling L. (1965). Evolutionary divergence and convergence in proteins. InEvolving Genes and Proteins, V. Bryson, H.J. Vogel (eds.), pp. 97-166. Academic Press, New York. 2. Felsenstein J. (1985). Confidence limits on phylogenies: An approach using the bootstrap. Evolution39:783-791. 3. Tamura K., Stecher G., Peterson D., Filipski A., and Kumar S. (2013). MEGA6: Molecular Evolutionary Genetics Analysis version 6.0. Molecular Biology and Evolution 30: 2725-2729.