Download

1 / 15
150 likes | 260 Views
This report examines historical benchmarks for lunch and dinner service in Spring 2007, focusing on measurable sales metrics such as average check amounts, item sales percentages, and costs. It emphasizes the importance of comparing like items and considering factors like seasonality and operation hours when assessing benchmarks. Insights into average checks, menu mix, and sales performance provide informative guidance for improving restaurant operations. These benchmarks are essential for effective decision-making and planning in the food service industry.

E N D
Historical Benchmarks HRT 383 Lunch & Dinner Spring 2007
What is a benchmark? • From Merriam-Webster Online: A point of reference from which measurements may be made http://www.m-w.com/cgi-bin/dictionary Accessed 10/08/04
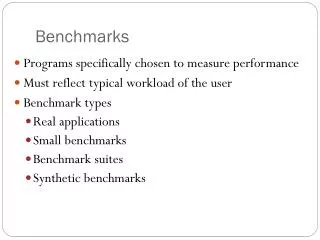
An Historical Benchmark is… • An historical point of reference • What did we do in the past? • Measurable • Dollars/Cents • Percentage • Count • Time • Weight • Volume
Cautions: • Compare “Apples to Apples” • Watch for differences in: • Volume • Days or Day-Part Variations • Number of operation periods • Hours of operation • Seasonality • “Like Items” • Menu prices • A La Carte vs. Banquets
Searching for Benchmarks… • Net Sales Analysis: • Daily or weekly sales in dollars • Total sales • Food sales • Beer sales • Wine sales • Bar sales • Daily or weekly guest count • Daily or weekly check average
Searching for Benchmarks… • Weekly Menu Mix/Sales History Analysis: • Item sales (by count or percentage) • Individual items (count or percent) • Category sales (count or percentage) • A la carte counts vs. banquet counts • Unless most other measures are equal (or close to equal), use percentages for benchmarks!
Searching for Benchmarks… • Bar Cost: • Daily or weekly percentages • Beer costs percentage • Wine cost percentage • Total bar percentage • Usually, weekly information is more accurate than daily information
Searching for Benchmarks… • Credits to Cost of Goods Sold: • Comps vs. Total Sales • Goodwill comps (marketing) vs. QSA • Waste report • Accuracy is critical • Use for information rather than benchmarks • Family meal issues
Searching for Benchmarks… • Weekly Summary: • QTD information • Counts • Check average • Sales • COGS • Quarterly food cost percentage • Weekly and quarterly bar cost percentage • Other expense categories by percentage
Searching for Benchmarks… • QTD Menu Mix/Sales History Analysis: • Item sales (by count or percentage) • Individual items (count or percent) • Category sales (count or percentage) • A la carte counts vs. banquet counts • Usually QTD information is used for benchmark percentages
Searching for Benchmarks… • Budgets: • Total Sales • COGS • Food cost percentage target is 50% • Bar cost percentage target is 40%
Searching for Benchmarks… • Lunch Menu Mix – Winter 2007: $13.93 Ave. Check • Appetizers 56.9% • Manager’s Special App 39.7% • #1-Selling Menu Entrée – Flat Iron Steak 8.3% • Turkado 7.4% • French Dip 6.7% • Manager’s Special Entrée 38.2% • A la carte to banquet = 70.1% / 29.9% • Desserts = 56.4% • Manager’s Special Dessert 39.9% • Beverages = 91.4%
Weekly Bar Sales 250 4.6% Food sales 5,140 95.4% Total Sales 5,390 Daily Bar Sales 50 4.6% Food sales 1,028 95.4% Total Sales 1,078 77 Covers/day @ $14.- Lunch Projection UPDATE
Searching for Benchmarks… • Dinner Menu Mix – Winter 2007: $34.86 Ave. Check • Appetizers 56.7% • #1-Flat Iron Steak 25.6% • #2-Lamb 15.3% • #3-Salmon14.5% • A la carte to banquet 73.4 / 16.6% • Desserts 60.2% • Beverages 101.7% • Bottled Wine 177 each • WBTG 448 each
Weekly Bar Sales 1,659 23% Food sales 5,556 77% Total Sales 7,215 Daily Bar Sales 553 23% Food sales 1,852 77% Total Sales 2,405 65 Covers/day @ $37.- Dinner Projection Revisit