Download
1 / 36
360 likes | 506 Views
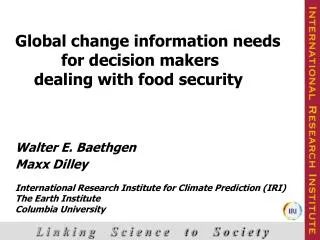
Global change information needs for decision makers dealing with food security Walter E. Baethgen Maxx Dilley International Research Institute for Climate Prediction (IRI) The Earth Institute Columbia University. cover box. L i n k i n g S c i e n c e t o S o c i e t y.

E N D
Global change information needs for decision makers dealing with food security Walter E. Baethgen Maxx Dilley International Research Institute for Climate Prediction (IRI) The Earth Institute Columbia University cover box L i n k i n g S c i e n c e t o S o c i e t y
Global change information needs for decision makers dealing with food security Decision Makers (including Policy makers): Extremely Heterogeneous Community (like “Users”) Global / International ... Country ... Village Different Decision Makers require different Information (demanded information is also extremely heterogeneous) L i n k i n g S c i e n c e t o S o c i e t y
Global change information needs for decision makers dealing with food security Example: Climate Change Information Typically: Food security maps for 2050’s- 2080’s cover box L i n k i n g S c i e n c e t o S o c i e t y
Multiple cropping zones 1961-90 Season Length 1961-90 Multiple cropping zones 2080 Season Length 2080’s Rainfed cereals: CC Impacts 2080’s L i n k i n g S c i e n c e t o S o c i e t y
Global change information needs for decision makers dealing with food security • Food Security Maps at Global Level: • Excellent for COP negotiators (UNFCCC) • Excellent for increasing general awareness • Useful for UN-type organizations (FAO, UNDP, WB, IFPRI) cover box • At Country Level: • Place Climate Change as a “Problem of the Future” • Beyond the agenda of Decision / Policy Makers (2080’s) L i n k i n g S c i e n c e t o S o c i e t y
Global change information needs for decision makers dealing with food security • At Country Level: • Most commonly, Global information is not easily applicable • Degree of Uncertainty • Full agenda with immediate-term issues (vs 2050’s) • requiring immediate action. cover box Challenge: Overcome the “Incompatibility” of Time Frames Introduce Global Change Issues in Development Agenda L i n k i n g S c i e n c e t o S o c i e t y
Global change information needs for decision makers dealing with food security Overcoming the “Incompatibility” of Time Frames 1. Climate Change is happening now (vs 2050’s, 2080’s) 2. Climate change is affecting and will continue to affect societies through increased Climate Variability often including more frequent and more damaging Extreme Events (droughts, floods, etc.) L i n k i n g S c i e n c e t o S o c i e t y
Premise One of the most effective ways for assisting agricultural stakeholders to be prepared and adapt to possible Climate Changescenarios, is by helping them to better cope with current Climate Variability Overcomes time frame Incompatibility: Actions are needed within Policy Makers term Results of actions can be verified also within the PM term
Global change information needs for decision makers dealing with food security Examples of Information that can assist Decision Makers at Country (or smaller) scale Decision Support tools tailored for different Policy Makers but focused on Climate Variability and its impacts (on food security and other) cover box L i n k i n g S c i e n c e t o S o c i e t y
A few common features of Decision Support Systems with shown success: Understanding the past effects (linking CV, crop yields, responses, etc) Strong component: MONITORING (measuring) the present Adequate and understandable FORECASTS Risk Assessment / Risk Management Approach cover box L i n k i n g S c i e n c e t o S o c i e t y
Understanding the Baseline: Measuring food security Slides courtesy T. Boudreau, Food Economy Group/FEWS)
Climate Variability Households become food insecure when they cannot meet 100% of food requirements % annual food requirements
Food Economy Zones (baseline)
Baseline and Method for Running Scenarios: Simple Spreadsheet… Exploring possible responses
Climate Change/Variability impacts on food security Assess Past Impacts Develop good Monitoring Improve Forecasts / Scenarios Explore/Propose Responses
Forecasting food security variables from climate models, Oct-Dec season(climate prediction research by M. Indeje, IRI) The following slides show "hindcast" and forecast skill between observed and predicted rainfall values for October-December for high-skill areas in the Greater Horn of Africa (Prediction skill for March-May or June-September is lower)
Statistically corrected ECHAM4 GCM Oct-Dec precipitation to a station Corr_coef. = 0.8 OBSERVATION Model -MOS CORRECTED
Correlation between statistically corrected climate model output and observed rainfall, Oct-Dec
Still one step is needed: Results are expressed in “terms” that Decision Makers do not use (e.g., Rainfall) Need to “Translate” information to the same terms that Decision Makers use (crop yields, pasture availability, water in reservoirs, etc.) cover box L i n k i n g S c i e n c e t o S o c i e t y
NDVI forecast skill, Oct-Dec • Correlation between: • GCM precipitation for October-December (runs from September*) • December NDVI values. • (Eastern Kenya r=0.74) (*) persisted-SST and 850mb zonal wind forecasts
COF11 – Forecast Crop Conditions at End of Season Actual Crop Conditions at End of Season Predicting end-of-season crop conditions using the Water Requirements Satisfaction Index Slide Courtesy G. Galu
Translating Climate Information into Food Security Information Regional food security outlooks based on climate forecast-derived projections of crop yields, livestock condition and other food security-related variables, and use as input into a livelihoods-based food security analysis
Involving the Decision Makers: • Developing Trust • Affecting / Changing Decisions • Assisting policies L i n k i n g S c i e n c e t o S o c i e t y
October 1999 November 1999 January 2000 February 2000 December 1999 IMPORTANCE of MONITORING Example in Uruguay Decision Support System Provided this Information to MAF and to National Emergency System (Evolution of the Drought)
Remote Sensing Volume Changes in Water Reservoirs during the 1999/2000 drought (prepared for the National Emergency System) Example in Northern Uruguay 19 January 23 March
Ing. Juan Notaro, Uruguayan Minister of Agriculture in 1999/2000 (Letter to our INIA-IFDC-NASA Project) "(...) The results of your work during the recent drought were useful for making both, operational and political decisions. From the operational standpoint, your work allowed us to concentrate our efforts in the regions highlighted as being the ones with the worst and longest water deficit. We prioritized those identified regionsfor concentrating the use of our resources, both financial aid and machines for dams, water reservoirs, etc. (...) From the strictly political standpoint, your work provided us withobjective information to defend our prioritization of regions, in a moment in which every governor, politician and farmer in the country was asking for aid. We received no complaints in this respect. In the same line, your work also allowed to mitigate pressuressince we provided the press and the general public with transparent, technically sound and precise information”.
Ing. Juan Notaro, Uruguayan Minister of Agriculture in 1999/2000 (Letter to our INIA-IFDC-NASA Project) "(...) The results of your work during the recent drought were useful for making both, operational and political decisions. From the operational standpoint, your work allowed us to concentrate our efforts in the regions highlighted as being the ones with the worst and longest water deficit. We prioritized those identified regionsfor concentrating the use of our resources, both financial aid and machines for dams, water reservoirs, etc. (...) From the strictly political standpoint, your work provided us withobjective information to defend our prioritization of regions, in a moment in which every governor, politician and farmer in the country was asking for aid. We received no complaints in this respect. In the same line, your work also allowed to mitigate pressuressince we provided the press and the general public with transparent, technically sound and precise information”. The results of your work during the recent drought were useful for making both, operational and political decisions.
Ing. Juan Notaro, Uruguayan Minister of Agriculture in 1999/2000 (Letter to our INIA-IFDC-NASA Project) "(...) The results of your work during the recent drought were useful for making both, operational and political decisions. From the operational standpoint, your work allowed us to concentrate our efforts in the regions highlighted as being the ones with the worst and longest water deficit. We prioritized those identified regionsfor concentrating the use of our resources, both financial aid and machines for dams, water reservoirs, etc. (...) From the strictly political standpoint, your work provided us withobjective information to defend our prioritization of regions, in a moment in which every governor, politician and farmer in the country was asking for aid. We received no complaints in this respect. In the same line, your work also allowed to mitigate pressuressince we provided the press and the general public with transparent, technically sound and precise information”. your work provided us withobjective information to defend our prioritization of regions, in a moment in which every governor, politician and farmer in the country was asking for aid.
Involving the Decision Makers (2): Move from “Supply” Approach To “Demand Driven” Approach
Pilot Project IFDC/INIA/NASA: Climate Forecast Applications in Agriculture Workshops (Quarterly) Regional Outlook Regional Outlook Meetings “TWG” Nat. Climate Res. Ctrs. Tech. Reps. Agri-Business MAF Planning Policies NGOs Gov.Organiz. Growers Local Outlook ENSO and “Global” Climate Forecasts Local Outlook IAI Needs (Variables, Timing, Tools) Tools (IDSS) IFDC INIA NASA Un.Fla. QSLD IRI NOAA ECMWF Others Met. Service Insurance Credit Media Internet
Workshops (Quarterly) “TWG” Nat. Climate Res. Ctrs. Tech. Reps. Agri-Business MAF Planning Policies NGOs Gov.Organiz. Growers Local Outlook Needs (Variables, Timing, Tools) Tools (IDSS) IFDC INIA NASA Un.Fla. QSLD Insurance Credit “Hands-on” Training (Education) for Users (CC, CV, probabilities, role of FCSTs, risks) Demand for Researchers (info and tools)
Who are the “clients”? “Users” DS Tools: Risk Assessment Risk Management
Ministries Agro, Health, Water “Users” DS Tools: Risk Assessment Risk Management Insurance Credit NGOs Advisers
(Pilot Projects: Keep on track) Ministries Agro, Health, Water “Users” DS Tools: Risk Assessment Risk Management Insurance Credit NGOs Advisers
Final Comments • Introduce Climate Change in current agendas overcoming • time frame incompatibilities: • CC is a current problem • CV approach Translate Climate information to the terms that Decision Makers use to make decisions Involve Decision Makers from the start (Demand-driven approach) • Develop Decision Support Systems (Risk Assessment/Risk Management • approach) that assist: • Understanding the past • Monitoring the present • Forecasting the future (probabilitistic scenarios) L i n k i n g S c i e n c e t o S o c i e t y
Thank you! Walter E. Baethgen Maxx Dilley International Research Institute for Climate Prediction The Earth Institute, Columbia University L i n k i n g S c i e n c e t o S o c i e t y