Download
1 / 20
200 likes | 341 Views
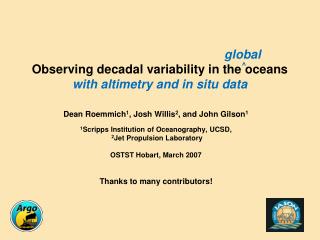
Argo observes global variability in the oceans. Dean Roemmich and John Gilson Scripps Institution of Oceanography, USA IUGG Perugia, July 2007. Outline.

E N D
Argo observes global variability in the oceans Dean Roemmich and John Gilson Scripps Institution of Oceanography, USA IUGG Perugia, July 2007
Outline • Status: Argo has provided global measurements of temperature, salinity, and circulation in the upper 2000 m since early 2004. With nearly 3000 floats and global coverage, Argo now enters a new “sustained” phase of implementation. • ANNUAL CYCLE: The present dataset provides a stable mean and annual cycle; the southern hemisphere oceans have greatest seasonal heat storage; the north dominates seasonal freshwater storage. • THE MODERN BASELINE: Argo has established a modern baseline for comparison to previous data (e.g., WOA, WGHC, Willis et al., 2004, …) on decadal timescales as well as for data assimilation and model initialization. • GLOBAL/DECADAL VARIABILITY: The decadal changes revealed by Argo are due to changes in the wind-driven circulation as well as to the heat and hydrological balances. • FUTURE EVOLUTION: Continuation of the Argo array and extension of its range into ice-covered regions, marginal seas, and the abyssal ocean, are central to describing the state of the climate system and its variability.
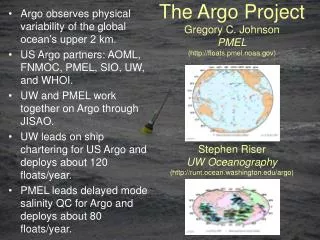
Argo’s defining characteristics: a broad-scale array with global coverage of the upper ocean. As of May 2007 there were 2856 active Argo floats deployed by 23 national programs. • Presently, more than 8000 T,S profiles are obtained per month. • Data are publicly available in real-time and delayed-mode (research). • More floats are needed at high southern latitudes, 45oS-60oS. • Development is needed for: • Sampling under ice. • Marginal seas. • Deep ocean. • Additional sensors.
A gridded Argo dataset 0 – 2000 m temperature anomaly from annual mean 60oS - 60oN 0oN - 60oN 60oS – 0oS • Grid spacing: 1o x 1o x 1 month (but resolved scales are larger). • Period: Jan 2004 – May 2007 (41 months, 200,000 Argo profiles). • R/T salinites adjusted to historical T/S near 2000 m. • WHOI/FSI data removed; no XBT or other data types (floats only). • Objective mapping: first monthly means (over all years), then anomalies. • Covariance similar to altimetry (Zang and Wunsch, 2001) but derived from Argo.
Annual cycle of zonally-integrated heat content Zonally integrated heat content (anomaly from the annual mean, 0 – 500 m, 1016 J/m latitude) shows that the southern hemisphere oceans gain and lose more total heat annually than the northern oceans due to their larger area. Signals, especially tropical, include annual thermocline heave. 20oS-60oS Heat content (1022 J) 60oS-60oN 20oN-60oN
Annual cycle of zonal mean freshening Zonal mean rate of monthly freshening (cm/month, based on time derivative of 0-100 m salinity). The southern winter has freshening at mid-latitude due to excess rainfall, but gets saltier at high latitude by evaporation and vertical entrainment. Freshwater content (km3) 0oS-60oS 60oS-60oN The northern hemisphere signal (right) is due to seasonal storage on land, i.e. as ice and in reservoirs during winter. 0oN-60oN
Winter 2006 sea surface conditions 5m S 5-m salinity (upper panel, colors) and mixed layer depth (lower panel, colors) are shown for the winter of 2006 (JFM northern hemisphere, JAS southern). Overlaid contours are 5-m σθ. Water mass formation regions and characteristics are seen for subtropical and subpolar mode waters. MLD
Global mean temperature Argo provides a baseline, but comparison to earlier eras is problematic due to spatial coverage (Gregory et al., 2004, Gille, 2007) and possible instrumental biases (Gouretski and Koltermann, 2007) in the earlier data. Here, global mean temperature for Argo (2004-2007) compared to pentadal gridded data of Levitus et al. (GRL, 2005). Both datasets are averaged over a common domain defined by Argo sampling, and are plotted as anomalies relative to the Levitus et al. 2005 mean. Argo Levitus et al., 2005 0 – 2000 m avg Change in global mean of T vs D from 1957 to 2007.
Zonal mean of T, S and σθ Zonal and annual mean of Argo (contours) temperature (upper), salinity (middle), and σθ(bottom), with color shading of Argo minus WOA01 difference (top and middle) or vertical displacement (bottom). T S σθ
Zonal mean ΔT using different historical datasets T(zonal avg): Argo (2004/6) minus WGHC (Gouretski and Koltermann, 2004). T(zonal avg): Argo (2004/6) minus WOA01 (Conkright et al., 2002). T(zonal avg): Argo (2004/6) minus Willis (1993/5) (Willis et al., 2004) Similarity in pattern suggests decadal and multi-decadal changes are not greatly different.
Zonal mean ΔT by ocean basin, Argo minus WOA01 XY-avg of ΔT • Average temperature anomaly is 0.03oC (8 x 10²² J globally) • Strongest warm anomalies at 40oS, 60oN • Cool anomalies (upward displacement) at 20oS, 20oN, 40oN.
Zonal mean ΔS by ocean basin, Argo minus WOA01 XY-avg of ΔS • Atlantic (0-200 m) has freshwater deficit in Argo data relative to WOA01 (.05 psu) • Pacific (0-200 m) has surplus (.01 psu). • Freshening at intermediate levels in the southern hemisphere in all oceans (strengthening of signals described in WOCE minus historical data, e.g. Wong et al., 1999, Curry et al., 2003).
0 – 100 m ΔS, Argo minus WOA01 Zonal mean of 0 – 100 m ΔS • Subtropics saltier, esp SE Pacific and N Atlantic • Subpolar regions fresher except N Atlantic. • ITZ fresher, especially western Pacific. • Atlantic saltier, Pacific fresher.
Zonal mean of salinity on σθ Zonal mean salinity, Argo (contours) and Argo minus WOA01 (colors), on σθ surfaces. These differences, such as the freshening of Sub-Antarctic Mode Water, are likely to represent decadal/multi-decadal changes. S on σθ
Steric height, 0/2000db Argo, 2004/2006 The large Southern Ocean steric height anomaly in Argo relative to WOA01 is a decadal wind-driven feature (Roemmich et al., JPO 2007, Qiu and Chen, 2006). Argo - WOA01
Southern Ocean: the recent decade Altimetric height (AVISO): 2004/06 minus 1993/95 Steric height (0/750 m): 2004/06 (Argo) minus 1993/95 (Willis) But the spin-up signal extends to 2000 m. Altimetric height and steric height time-series at the gyre center track the circulation strength (ibid). Argo minus WOCE steric height, Roemmich et al., (2007) 1000/1800 200/1800 SSH and 0/2000 db SH
Tropical Pacific/Indian: the recent decade ΔALT Indian Pacific ΔSTERIC The change in altimetric height (blue), steric height (0/750 m, red), and temperature from 1993/1995 to 2004/2006. Temperature and steric height for the two periods are from Willis et al. (2004) and Argo respectively. A multi-decadal decrease in the Pacific tradewindsreversed in the most recent decade (McPhaden and Zhang, 2002, 2004). The recent 10-year signal in the ocean is a warming and downward displacement of the thermocline in the western tropical Pacific, cooling in the east, consistent with a modest increase in the trades. Zonal wind stress averaged over 10oN-10oS, 150oE-80oW, NCEP 60-month running mean 12-month running mean
North Pacific and North Atlantic: the recent decade Altimetric height (AVISO): 2004/06 minus 1993/95 Steric height (0/750 m): 2004/06 (Argo) minus 1993/95 (Willis) • Subtropics mostly high (spin-up). • Northern WBCs and extensions low (e.g. Douglass et al., 2006 for the Pacific). • Subpolar gyres high (spin-down, e.g. Hakkinen and Rhines, 2004 for the Atlantic). • Strong warming and high salinity in the northern North Atlantic is recent, reverses earlier decadal freshening (Hatunet al., 2005, Peterson et al., 2006).
Summary: Decadal ocean variability • The Argo array has collected global observations for 3+ years, providing a stable estimate of the mean and annual cycle of upper ocean temperature and salinity, and a baseline for comparison to earlier datasets. • Decadal anomalies in the wind-driven circulation are largely responsible for the observed spatial variability of altimetric and steric height decadal changes. • The patterns of decadal variability span more than one ocean basin (N Atl/N Pac, S Atl/S Pac/S Ind) at middle and high latitude in both hemispheres. • Decadal changes extend to depths of at least 2000 m. • Comparing Argo salinity to WOA01, salinity has increased in the upper 200 and decreased below. The Pacific has become fresher and the Atlantic saltier (net transfer of freshwater).
As we contemplate Argo’s transition to a sustained array: • A proposal for a deep component to Argo. • Motivation: • There are important climate signals below 2000 m; the deep ocean is warming, the separation of steric and mass-related sea level requires deep data. • These signals will not be adequately observed by other programs (repeat hydrography, time-series stations). • Also, Argo needs a source of highest quality T/S profiles for salinity adjustment. • Feasibility: • A few hundred deep floats sufficient (?) globally. • Stronger float pressure case needed; more buoyancy control required; greater energy usage (50 cycles @ 1/month (?)). • Float recovery needed for post-calibration; also shipboard CTD casts. • Floats could be programmed to act as “time-series stations”. • Dedicated small vessel required (RV Argo). Feasibility: A single vessel, RV Kaharoa, 28-m length with crew of 5, has deployed 439 of the presently active Argo floats (red dots) in the South Pacific, North Pacific and South Indian Ocean. Similar vessels could maintain Argo, including a deep component.