Micro Data For Macro Models
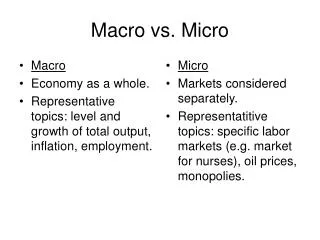
E N D
Presentation Transcript
Micro Data For Macro Models Fall 2017 Lecture 1 (Prologue and Consumption Inequality)
1998 – 2000 Cohort That Are Tenured at Top Schools (with some omissions because my memory is bad)
1998 – 2000 Cohort That Are Tenured at Top Schools (with some omissions because my memory is bad)
Chicago Placements Last year: 25 or so students on the market o 14 went to academic positions o Of those, only 6 went to top 40 places (Yale econ, 2 Penn State econ, Maryland econ, London Business School finance, Carnegie Mellon) o Others (Illinois, San Diego Public Policy, Texas finance, etc.) o 5 went to government agencies (foreign central banks, World Bank) o 6 went to consulting. Last year was probably a typical year. Slightly more than half go to academic jobs – about one-quarter to top 40 places.
Publishing? The median Ph.D. from a top 20 department never publishes anything in a peer reviewed journal The median peer reviewed article has less than 15 citations. See Dan Hamermesh’s: “Young Economist’s Guide to Professional Etiquette” http://www.unifr.ch/wipol/assets/files/PhD%20Course/JEP92_Hamermesh.pdf
The Good News The creation of research is a skill just like inverting a matrix, solving DSGE models, computing standard errors, etc. The more you work on it, the better you will become. Read the early work of those recently tenured at top schools. Every single one of you could have written the same papers. It is not only our technical prowess that distinguishes us throughout our careers, it is our ability to innovate and/or to come up with good questions. Those who have impact on the profession do so because of their ideas.
What Skill Are Ph.D. Students Most Deficient? Having the ability to identify interesting research questions The confusion of theoretical or empirical fire power as being an “end” as opposed to a “means”. Not having the ability to explain why anyone would care about their research.
Goal of This Class Get you to start thinking about writing your dissertation Familiarize you with many data sets that are used by macro economists (and others) to be used as part of your dissertation. Expose you to literatures within macroeconomics that have strong empirical components. Help you turn good research ideas into good research papers. Teach you how to communicate your ideas to others.
Some Housekeeping…. T.A.: John (will set up an email list for class participants including auditors) Lots of work – hopefully all of it useful o Reading o Homeworks o Course Presentations Slides/Course Info (on my faculty web page) Co-Taught with Tom Winberry
My Portion of the Course: Household Datasets Topic 0: Prolouge Topic 1: Consumption Inequality Topic 2: Labor Markets Since 2000 Topic 3: Non-Market Production, Consumption and Labor Supply Topic 4: Regional Economics Topic 5: Occupational Choice Maybe some other stuff if time allows
Very Important Marco Sequence Requirement 1) Take at least 3 of 4 courses in the sequence for a grade. Secure a grade of B or better in 3 of 4 courses. 2) Sequence Requirement: Research Paper due 7/31/2017 3) Need one of the six faculty members to serve as a reader. 4) Need to contract with your reader by April 30th, 2016. 5) See our syllabus for more details.
Anatomy of Writing an Research Paper Identifying a research topic a broad level o What broad area of research are you trying to speak to? o What existing research is done on that literature? o Is it interesting to contribute an answer to this broad research question? Identifying a research topic in the narrow o What is the specific question you are trying to address? o What existing research is done on this specific question? o Is the answer to this specific question interesting? o Do you have a way to answer this specific question?
Anatomy of Writing an Research Paper Executing the specific research question o How do you tease out your mechanism from many other mechanisms? o What type of identification are you using to identify your mechanism (for empirical papers). o What drives that identification (for empirical papers). o Good questions without a good research design is just philosophy and/or killing trees. Conveying the output of the research o Your ideas need to be conveyed to others in order to have impact. o Main way in which ideas are conveyed: written research paper. o Seminars are another way to convey the research idea. o Need to be clear in both writing and verbal presentations.
Example of the Research Process Question in the Broad o Why has U.S. Labor Force Participation Rate (and Employment to Population Rate) fallen so sharply in recent years and remained at such a low level. a. Why is this question interesting? b. Is the fact true? Advice: It is always good to start your research process with interesting background facts.
21-30, Ed < 16: 18% Decline Since 2000 31-55, Ed < 16: 10% Decline Since 2000
Declines in Hours Worked 2000-2016 By Age, Sex and Skill (Excluding Full Time Students)
Declines in Annual Hour Worked During 2000s By Age, Sex and Skill (Excluding Full Time Students)
Declines in Annual Hour Worked During 2000s By Age, Sex and Skill (Excluding Full Time Students)
Summary of U.S. Labor Markets in the 2000s • Prime age employment has declined sharply since 2000. Hours decline mostly driven by extensive margin decline. • Declined slightly prior to the recession, declined sharply during the recession and has rebounded only modestly through early 2017. • Declines were sharpest for: • o Less educated • o Men • o Young • Declines are very large by historical standards. Between 2000 and 2016, hours of less educated younger men fell by 242 hours per year. • Question: Why has hours of prime age workers fallen so sharply during the 2000s?
Research Question Process Research question in the broad: o Why has the employment to population ration been falling? Next Steps o Can we move from a “research question in the broad” to a “research question in the narrow”?
Example of the Research Process 2. Question in the Narrow o How much can the recent decline in manufacturing employment explain the rise in non-employment of U.S. workers? o Why didn’t this effect show up sooner in aggregate statistics? o What is the mechanism by which a sectoral decline can lead to increases in non-employment? Hint: Can some preliminary data lend potential plausibility to this hypothesis?
~2 Million Jobs Lost During 1980s and 1990s
~2 Million Jobs Lost During 1980s and 1990s
~2 Million Jobs Lost During 1980s and 1990s
Example of the Research Process 3. Going from research question to actual implementation….. o Can one construct a research design to test the specific research question? o What type of variation can help to test the hypothesis? o What assumptions are necessary to make this variation useful to test the hypothesis? - “Wish” criteria (what do you “wish” drives the variation). - “Plausibility” criteria (is your “wish” plausible).
Open Lecture Slides 1a The Lecture Slides “charles_noto_hurst_phd_lecture1.ppt” will go through the research design of my paper: “Manufacturing Decline, Housing Booms, and Nonemployment”
Goals of the Class Revisited Homeworks o The homeworks are designed to getting you thinking about the components of the research process. Presenting papers o Help you see the research process of others through your presentation. Help you work on communicating ideas to others. 3. Lectures o Tom and I will try to bring in our perspective on the research process through our discussions.
“Where Do Ideas Come From?” Question that Ph.d. students ask most. Where do ideas come from? o Reading literature (seeing holes in existing literature, being unsatisfied with the consensus views on a topic, etc.) o Trying to understand world around us (“What drives employment rates?”, “How would one measure policy uncertainty?”, etc.) o Exploring data sources (my work on time trends, etc.) o Talking with other graduate students! Pick projects you are interested in. If you are not interested in the answer to your question, no one else will be either!
Part A:Background on Household Surveys(John will Expand on this in TA Sessions)
Micro Expenditure Data: Household Surveys Consumer Expenditure Survey (U.S. data) Starts in 1980 Broad consumption measures Some income and demographic data Repeated cross-sections Panel Study of Income Dynamics (U.S. data) Starts in late 60s Only food expenditure consistently Housing/utilities (most of the time) Broader measures (recently) Very good income and demographics Panel nature
Micro Expenditure Data: Household Surveys British Household Panel (British Data) o Panel data including income and expenditure Family Expenditure Survey (British Data) Bank of Italy Survey of Household Income and Wealth (Italian Data) o Panel data including income and expenditure There are others….many Scandinavian countries, Japan, Canada, etc. Even some developing economies have detailed household surveys that track some measures of consumption (e.g., Mexico, Taiwan, Thailand)
Micro Expenditure Data: Scanner Data Nielsen Homescan Data o Large cross-section of households o Very detailed level transaction data (at the level of UPC code) o Some demographics o Some panel component o Matches quantities purchased with prices paid o Covers most of the large MSAs o Measurement error? o Selection? o Coverage of goods?
Micro Income/Employment Data: Household Surveys Current Population Survey (CPS) o Usual data set used within U.S. to track labor supply and earnings. o Has panel component. o Can be found at www.ipums.org/cps/ PSIDCan be found at http://psidonline.isr.umich.edu/ Survey of Income and Program Participation (SIPP) o Four year rotating panel o Larger sample sizes o Over samples poor Census/American Community Survey o Can be found at www.ipums.org o Extremely large samples – facilitates regional analysis
Micro Income/Employment Data: Household Surveys National Longitudinal Survey of Youths (NLSY) o Follows a cohort of young individuals (12-16-ish in the initial year) o Cohort 1: 1979 ; Cohort 2: 1997 o Has panel component. o Can be found at http://www.bls.gov/nls/