Download
1 / 16
160 likes | 274 Views
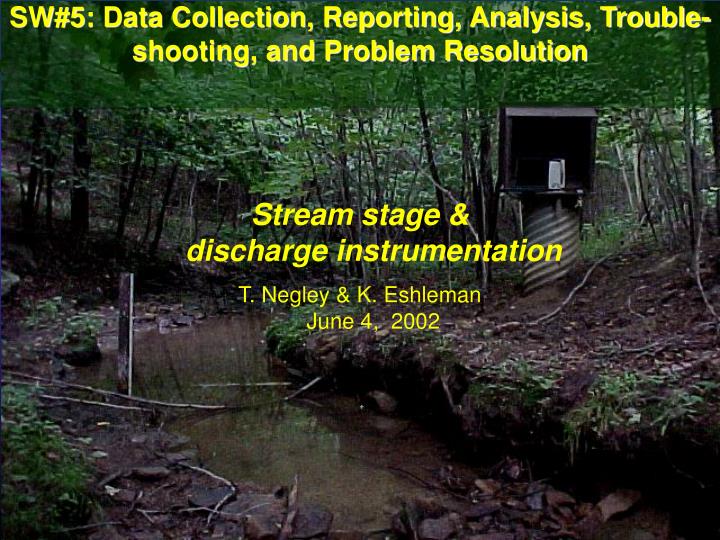
SW#5: Data Collection, Reporting, Analysis, Trouble-shooting, and Problem Resolution. Stream stage & discharge instrumentation T. Negley & K. Eshleman June 4, 2002. OVERVIEW. Hydrologic terminology Stage-discharge rationale Obtaining a hydrograph Reporting streamflow data

E N D
SW#5: Data Collection, Reporting, Analysis, Trouble-shooting, and Problem Resolution Stream stage & discharge instrumentation T. Negley & K. EshlemanJune 4, 2002
OVERVIEW • Hydrologic terminology • Stage-discharge rationale • Obtaining a hydrograph • Reporting streamflow data • Example: computing MAT1 water balance
HYDROLOGIC TERMINOLOGY • Stage – the depth of flow in a stream, usually measured from some arbitrary datum. • Discharge – the volume flux of water. (Q = UA [L3T-1]) • Gaging Station- a structure specifically located to record water depth as a function of time. • Gage Height – the elevation of the water surface relative to a pre-determined datum (typically mean sea level). • Rating Curve – a relationship between stage and discharge used to convert continuous measurements of water depth to a discharge hydrograph • Channel Cross Section – the two-dimensional width and depth of the stream at a specified location. • Hydrograph– a graphical representation of continuous streamflow (either stage or discharge) over some time period. • Control – a structure (either natural or man-made) that fixes the relationship between stage and discharge over long time periods. • Water Balance – a calculation of the inputs, outputs, and change in storage for a given control volume (e.g., catchment or lake) over a given time period.
STAGE-DISCHARGE RATIONALE The idea that when a stream channel contains a control section, the depth of streamflow and the volume flux of water in the stream channel are related. This relationship or rating curve, can be used to convert values of stream stage to instantaneous discharge.
OBTAINING A HYDROGRAPH • Select suitable gaging location • Obtain continuous record of stream stage • Develop rating curve & equation • Compute continuous record of instantaneous discharge • Numerically integrate the discharge record • QC data and verify the stability of the rating curve
Continuous stage observations • Gaging stations are used to continuously record stream stage so that a rating curve can be later applied to calculate a continuous record of discharge. • For artificial controls (e.g., weirs or flumes) this is pre-determined during the manufacturing of the control. • For natural controls (e.g., bedrock dams) this is determined via field measurements of stage and discharge over various flow conditions.
Gaging considerations & troubleshooting • Gage recorder should be checked against staff gage routinely. If necessary, recorder should be adjusted (use caution under high flow conditions!). • Control must be kept free of debris at all times. • Both the control and stilling well should be kept ice-free at all times. • Flumes should be checked routinely for scouring and seepage under the gage (and if necessary repaired).
Field observations of discharge h4 w4 Q = UA [L3T-1] A = wh Measure U at 0.4h from stream bottom
Rating equations • Plot field observations of instantaneous discharge (Q) values vs. instantaneous gage height values. • Fit a line (typically a power function if arithmetic axes OR log-transform data) to the field observations of discharge and stage. • Compute the equation for the best fit line (rating equation)
EBNR rating curve 6/5/2001
Computing instantaneous dischargeSee “Numerical Integration of Discharge” • Stage observations are usually made at even 1-hr or 15-min intervals • To convert a continuous record of instantaneous stage observations to discharge, substitute observed stage values into the rating equation. • Example: EBNR Rating Equation (6/2001): Q cms = 45.95 [stage (m)] ^ (4.506)
REPORTING DATA • Annual water balances (see example) • Minimum and maximum flows • Runoff ratios • Annual hydrographs and hyetographs
Annual water balances • Includes inputs, outputs, and changes in storage • Typically calculated by water year (1 October – 30 September) • Values are usually expressed in depths or percent yields
EXAMPLE: Annual water balance for TMAT1Water year 2001 (1 Oct 2000 – 30 Sep 2001) • Given: • Drainage area = 27.1 ha • Annual mean daily discharge = 0.00232 m3/sec • Total annual precipitation = 1072 mm/yr • Compute: • Total rainfall (mm/yr) • Total watershed runoff (mm/yr) • Evapotranspiration (mm/yr)
EXAMPLE: 2001 Annual water balance for TMAT1 To get annual watershed runoff [L T-1] • All data should be archived as average daily flows (e.g., average of 24 – hourly oberservations) • Compute annual average daily flow (calculated as the arithmetic mean of all the average daily discharge values for the wyr typically in m3/sec) • Compute total discharge volume for wyr [L3/yr] • Convert total discharge [L3 T-1] to total runoff [L T-1] by dividing by watershed area • BE CAREFUL OF UNITS!!!!!