Download
1 / 19
190 likes | 305 Views
Biology 8.3 Studying Heredity: Punnett Squares. Studying Heredity. Punnett Squares. Animal breeders try to breed animals with specific characteristics such as speed, endurance or strength. To do this, breeders must be able to predict how a trait will appear when two animals are crossbred.

E N D
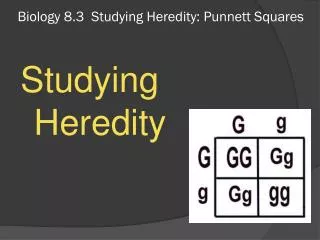
Biology 8.3 Studying Heredity: Punnett Squares Studying Heredity
Punnett Squares Animal breeders try to breed animals with specific characteristics such as speed, endurance or strength. To do this, breeders must be able to predict how a trait will appear when two animals are crossbred. One way to predict expected results of a single trait is with a diagram called a Punnett Square
Punnett Square • A Punnett Square is a diagram that predicts the outcome of a genetic cross by considering all possible permutations of the gene combinations for a trait when crossed.
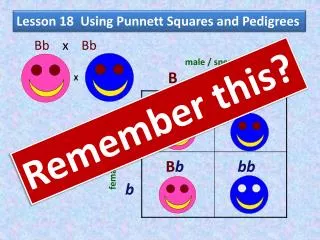
Punnett Square • The possible gametes that one parent can produce are written along one side; B and b • The possible gametes that the other parent can donate are written across the other side, B and b. • Remember, capital B represents a dominant trait while lowercase brepresents a recessive trait. Remember: when a dominant trait is present (B) it will overpower the recessive trait (b) and control the appearance (purple flowers). When only the recessive is present (bb), than the white will appear.
Punnett Square • Each box is filled in with the letter combinations that show the result when an allele from one genotype is combined with the allele from the another genotype. • Bb represents the genotype of each parent for the trait. • B or b represents the allele
Punnett Square • When allele B is combined with the other allele B, the result is a genotype BB in the box on the Punnett square. • Allele B and allele b combine to create genotype Bb in two of the grid boxes. • Last, alleles b and b combine to create a genotype bb in the last grid box.
Punnett Square • The figure at right shows the results of a hybrid cross between two pea plants that are both heterozygous (Bb) • Since the B represents the dominant trait, any of the combinations with a B in it will result in a purple flower. • 3 out of the 4 flowers will be purple. We can also say that the genotype ratio is 1 BB : 2 Bb : 1 bb • The phenotype ratio is 3 purple : 1 white Remember: the genotype is the pair of alleles (BB,Bb,bb) The phenotype is the physical appearance that results purple or white flower
Punnett Square • Animal and plant breeders often need to determine if an organism with a dominant trait they are breeding is heterozygous (Bb) or homozygous (BB or bb) • Horticulturists could perform a test cross to determine the genotype. • In a test cross, an individual whose phenotype is dominant (purple flowers) but whose genotype is NOT KNOWN, is crossed with a homozygous recessive individual Remember: the genotype is the pair of alleles (BB,Bb,bb) The phenotype is the physical appearance that results purple or white flower
Punnett Square • In the diagram at right, the genotype tt represents a recessive genotype. • What are the possible combinations that will result? • What is the probability that the recessive trait (t) will become the visible phenotype? • What is the probability that the dominant trait (T) will become the visible phenotype?
Punnett Square • In the diagram at right, the genotype ttrepresents a recessive genotype that would ordinarily be overshadowed by the dominant T. • What are the possible combinations that will result? • The 4 squares should read TT, Tt, tt, and tt. • Two of the squares will carry the dominant T trait while the other two squares will allow the recessive trait to come forward.
Ratios and Probabilities • Probability is the likelihood that a specific event will occur. • In the chart at right, the B is a dominant trait. Whenever the B is present in the crossbred genotype, the phenotype will be a purple flower. • The ratio is 3 : 1 in favor of purple flowers. (3 purple for every 1 white) • The probability is 3 out of 4 will be purple or 75% probability of purple. Remember: the genotype is the pair of alleles (BB,Bb,bb) The phenotype is the physical appearance that results purple or white flower
Ratios and Probabilities • In the table at right showing a crossbreed, the probability of the flower being purple (phenotype) is 3 out of 4 or 75% • The probability of the genotype being homozygous (BB or bb) are 2 out of 4 or 50% • The probability of the phenotype being heterozygous (Bb) is 2 out of 4 or 50% Remember: the genotype is the pair of alleles (BB,Bb,bb) The phenotype is the physical appearance that results purple or white flower
Ratios and Probabilities • The Punnett square at right shows the possible combinations for dogs with a particular color. • The mother (dam) has the dominant G and a recessive g making up her genotype. • The father (sire) has two recessive g’s (gg) making up his genotype. • When crossbred, the result is 4 possibilities; 2 blue phenotypes (Gg) and 2 black phenotypes (gg); a 50-50 split. • The black only appear because the recessive g in the father combine with both recessive traits in the mother to allow 2 gg combinations where a dominant trait does not overpower. This Punnett square shows a 50% probability for the pups to be either color
Pedigrees • Suppose you want to learn about an inherited trait in your family that is passed down through generations. • Geneticists create a pedigree to do this. • A pedigree is a chart of a family history that shows how a trait is present over generations in a family
Pedigrees • In the pedigree below, we see a key to it’s right that explains what each symbol means in the pedigree. Like a map, the key is important to reading the pedigree. • The pedigree shows us who is male, female, who is married to whom else, and each couples direct children both male and female. In this pedigree we follow the path of a genetic disease passed through three generations. 1st generation Key 2nd generation 3rd generation
Pedigrees • In this pedigree we can also see which children in which generations have been affected by a disease that was genetically passed down. • We see the original carrier was Sue but in following generations the disease only showed up in male children of the family. 1st generation Key 2nd generation 3rd generation
Pedigrees • A gene or trait may not appear in the genders equally. • If a gene is autosomal, it appears in both sexes equally. • If a gene is sex-linked however, it always appears only in one gender, usually males. • In the pedigree below we see that the genetic disorder has affected only the males in the following generations. This indicates it is a sex-linked genetic disorder 1st generation Key 2nd generation 3rd generation
Pedigrees • Here we see an example of a pedigree. The key at the bottom shows us the males and females that are the carriers of a genetic condition over three generations. • The disease appears in both males and females, therefore it is autosomal.
Key Concepts: • The results of genetic crosses can be predicted with the use of Punnett Squares • A test cross can be used to determine whether an individual expressing a dominant trait is heterozygous or homozygous • A trait’s pattern of inheritance within a family can be determined by analyzing a pedigree.