Download
1 / 47
470 likes | 479 Views
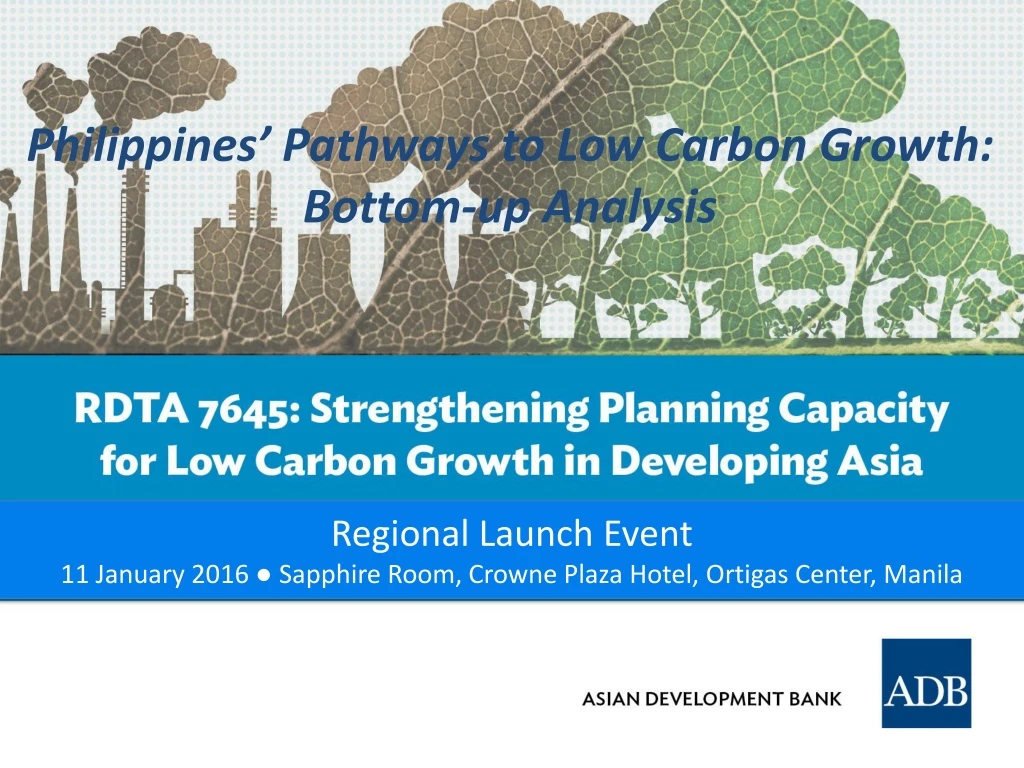
Join us for the regional launch event of the Philippines' Pathways to Low Carbon Growth report, focusing on the residential and land transport sectors. Learn about the bottom-up analysis conducted by the National Technical Working Group and discover the various models and tools used to analyze energy supply, demand, emissions, and costs. Gain insights into the projected scenarios for GDP, urbanization, population, vehicle ownership, and use. Explore the proposed strategies and options for low carbon growth in the land transport sector, including modal shifts, biofuel blending, promotion of buses and electric vehicles, and emission standards.

E N D
Philippines’ Pathways to Low Carbon Growth: Bottom-up Analysis Regional Launch Event 11 January 2016 ● Sapphire Room, Crowne Plaza Hotel, Ortigas Center, Manila
Philippines’ Pathways to Low Carbon Growth: Bottom-up Analysis RESIDENTIAL SECTOR LAND TRANSPORT SECTORPOWER SECTOR National Technical Working Group (NTWG) DENR CCC NEDA (Chair) DOE PSA Technical Support Team DPWH DOTC University of the Philippines National Engineering Center RDTA 7645 Strengthening Planning Capacity for Low Carbon Growth in Developing Asia
Modeling Tool EFFECT Energy Forecasting Framework and Emissions Consensus Tool General/ExogenousParameters: GDP, Population, Urbanization, Household Size & Income/Expenditures, Fuel Prices and Emission Factors Residential Transport Industrial Power Non-Residential ENERGY SUPPLY, DEMAND, EMISSIONS AND COSTS
Philippines’ Pathways to Low Carbon Growth: Bottom-up Analysis LAND TRANSPORT SECTOR
Land Transport Sector Model Macro Scenario GDP Urbanization Population
Land Transport Sector Model in EFFECT Private, commercial & governmental vehicle ownership & use For Passenger cars and Two-wheelers Macro Scenario GDP Urbanization Population 1. Projected Urban/Rural household vehicle ownership 4. Projected active population 5. Projected population changes 6. Projected use patterns Market development info Vehicle sales mix / year Change to vehicle population mix / year Income per 100 quantiles No. of households Mix of use patterns Average household size Total active vehicle population / year Average km travelled per vehicle related to age / year Annual replacement Vehicle sales volumes / year Household ownership of vehicles Household expenditure Per capita income projections Mortality calculations 7. Baseline ridership 8. Projected travel distance 2. Baseline pop of additional vehicles 3. Total baseline vehicle population Modal shift assump-tions Future passenger-km travelled / year Baseline vehicle-km travelled Disaggregated by e.g. Baseline survey of in-use vehicles Total active vehicle population in baseline year Type (subtype) Engine displacement Vehicle mortality calculations / year Technology Gross vehicle weight Average no. of passengers per vehicle Baseline passenger-km travelled Vehicle-km travelled / year Age Non-household ownership of vehicles Fuel use Historic vehicle sales data / year
Number of Vehicles in Philippines (in Million) • Increase in population of privately-owned vehicles is based on ownership models (Gompertz) using FIES 2012 data • Growth rates of other vehicles: • Tricycles: 2.2% (AAGR or public MC/TC, 2007-2013) • Jeepneys: 3.0% (AAGR of utility vehicles) • LCV Goods: 4.1% (AAGR of trucks) *2010 is historical data from LTO
Philippine Land Transport Sector: Baseline • Travel parameters for each vehicle class • Biofuel blending • Bioethanol: 10% up to 2050 • Biodiesel: Increase to 5% in 2020, stays flat until 2050
Land Transport Sector: Baseline 26.3 Gg of gasoline, 21.9 Gg of diesel by 2050 (898% and 402% increase from 2010 values) Gg= gigagram = 1 billion grams
Land Transport Sector: LCG Options • Biofuels Blending • Promotion of Buses • Baseline: 41,000+ buses by 2050 • Scenario: 82,000+ buses by 2050 • 10% of additional buses are BRT • Development of LRT • Modal shift to LRT = approx. 50% of PKT modal shift in the buses LEDS • PKT of buses on 2050: 73.6 billion passenger-kms • Modal shift (from private vehicles) to LRT on 2050: 37.5 billion passenger-kms • Motor Vehicles Inspection System • Operational in 2019 • 1% fuel efficiency improvement for all vehicles • CNG Buses • DOE target: 30% of buses run on CNG by 2030 • Electric Tricycles • DOE target: 230,000 E-Trikes by 2030 • Electricity consumption of each E-Trike = 0.085 kWh/km • Starting 2016, 3,000 of all new tricycles are electric • Number of new electric trikes will ramp up until 2030, and the % penetration will remain constant up to 2050 • From 2.7% in 2016, 33% of all new tricycles in 2030 are electric • 33% of all tricycles are electric by 2050
Land Transport Sector: LCG Options • Electric Jeepneys • Share of electric jeepneys by 2030: 50% (rollout is 2021 and all new jeepneys are electric by 2030) • Electric jeepney electricity consumption (COMET): 0.18 kWh/km • Rest of jeepneys comply with emission standards for light vehicles • Mileage of each electric jeepney reduced by 60% due to charging down time. Number of jeepneys is increased to compensate for reduction in VKT • Electric Motorcycles • 20% of all new motorcycles are electric by 2030, rollout starts on 2020 • Hybrid Buses • 30% of all buses are hybrid by 2030 • Fuel consumption of hybrid bus vs conventional bus (in g/km): 9:10 • Emission Standards • EU Emissions Target (average emissions for new cars) • 2015: < 130 g CO2/km • 2021: < 95 g CO2/km • Reduction of emissions is achieved by upgrading vehicle technology • Engine: turbocharging, valve control, downsizing • Body weight reduction • Use of hybrid technology • Philippines Target • Reduction program starts on 2020 • < 95 g CO2/km by 2035 for all passenger cars • < 147 g CO2/km by 2035 for all LCV • 15 year lag vs EU targets
Philippines’ Pathways to Low Carbon Growth: Bottom-up Analysis RESIDENTIAL (APPLIANCE) SECTOR
Residential Electricity Consumption Model Bottom-up Model • Forecast per centile: • No. of Households • Mean Household Size • Per capita expenditures (MPCE) • Household expenditures (MHHE) GDP Forecast Population Forecast Urbanization Forecast Base HH Expenditure per income bracket • Forecast per centile: • Electrified households • % of households with “appliance” • No. of “appliance” per household Regression Models %Electrification = f(MPCE) %WithAppliance = f(MPCE) UnitsPerHousehold = f(MPCE) Active Appliance Population (parc) Gompertz Model - Urban Electrification vs. MPCE App Sales Mix = Growth + Mortality Winfrey Survival Curves
Residential Electricity Consumption Model Number of Appliances ELECTRICITY DEMAND kWh Consumption per appliance x = Urban/Rural Demographics Income Group Data (income increases with GDP) Electrification vs. Income (FIES Data) Appliance ownership vs. income(FIES Data) Fixed usage parameter Future changes in appliance wattage • Inputted to the Power Generation module • Other useful outputs: • Appliance ownership • Average appliance efficiencies • Appliance sales
Philippines Residential Sector 92.1 million household population, 20.2 million households at about 4.6persons per household (PSA Data, May 2010) Household Statistics 72.06% in 2010 (DOE data) 79.12% in 2013 (DOE data) 90% target rate in 2017 Access to the electricity grid Electricity Demand 27.8% of total PH electricity demand, 2010 3.9% annual growth in electricity demand, 2000-2010 *Data obtained from the DOE Power Statistics 2013
Household Appliances Percentage Share of Appliances in Total kWh demand, 2011 The top five appliances contributes to more than 70% of the total HH demand. Refrigeration and air-conditioning load is expected to dominate electricity demand at a combined percentage share of 59% in 2050.
Residential Model Assumptions Ownership of energy-intensive appliances is expected to increase with growth in GDP.
Residential Sector: Baseline New appliance sales represent the potential for government intervention in terms of market regulation.
Residential Sector: Growth Scenarios Timing of Efficiency Improvements in the Baseline and LCG Scenarios
Residential Sector: Growth Scenarios The annual emissions attributable to the household electricity sector can be reduced by up to 16.7%in 2050. An average 11.6%annual energy savings can be achieved starting 2025.
Residential Sector: MACC TOTAL POTENTIAL 181.4MtCO2e -0.68 USD/tCO2e
Philippines’ Pathways to Low Carbon Growth: Bottom-up Analysis POWER GENERATION SECTOR
Power Generation Model (PEAKING LOAD) Demand Forecast Peaking Plant Baseload Plant MILLIONS OF PHP/YR Generation Capacity Expansion 0 10 20 30 40 50 60 70 80 90 100 % CAPACITY FACTOR Dispatch/ Production Simulations Capacity Reserve requirement to maintain 1 day/yr of LOLE MW (BASE LOAD) • Optimal Capacity Mix • Optimal Dispatch
Power Generation Sector: Baseline • Capacity addition will follow the optimal capacity mix: • 87.4% Baseload Plants • 12.6% Peaking Plants • Market forces will dictate the type of additional plants • Coal for baseload • (600 MW units for Luzon, 150-MW units for Visayas and Mindanao) • Diesel for peaking • Residential and Transport Sectors Demand • Bottom-up (EFFECT) • Commercial and Industrial Sectors Demand • 2014 to 2030: sectoral growth rates from DOE • 2031 to 2050: sectoral growth rates from the PHILGEM model
Power Generation Sector: Baseline Notes: For all scenarios, hydro, wind, solar, and geothermal plants are renewed at the end of their lifespan. Capacity credits were considered in capacity additions. Reserve requirement include forced and planned outages. Outage probability data were taken from NREL and NERC.
Power Generation Sector: LCG Options Renewable Energy Development • Geothermal Power • 2016 to2030: Add NREP Targets • 2030 to 2050: Add 100 MW capacity every 5 years • Hydro Power • 2016 to 2030: Add NREP Targets • 2031 to 2050: Add targets to maximize 13,000-MW hydro potential (11,100 MW large, and 1,780 MW small) • Wind Power • 2016 to 2030: Add NREP Targets • 2031 to 2050: Add 100-MW capacity every year • Total additions by 2050 reaches 3300 MW • Solar Power • 2016 to 2050: Add 50-MW capacity every year
Power Generation Sector: LCG Options Cleaner Fossil-base Power Development • Natural Gas Thermal Power Plants • Diesel will be replaced by NatGas SCGT as peaking plant • NatGas CCGT will be added as intermediate plants • Capacity additions follow the optimal mix: • 76.3% Baseload • 11.9% Intermediate • 11.8% Peaking • Supercritical Coal Thermal Power Plants • New coal-fired units rated 600 MW will be supercritical Nuclear Power Development • Wind Power • 2035 to 2050: 600-MW nuclear plants will be added instead of 600-MW coal plants.
Power Generation SectorCombined Scenarios(Avoid double counting)
Power Generation Sector: MACC 1 – Nuclear 2 – Hydro 3 – Geothermal 4 – Supercritical Coal 5 – NatGas 6 – Wind 7 – Solar 7 6 5 4 1 2
Philippines’ Pathways to Low Carbon Growth: Bottom-up Analysis Combined Sectors
PH Low Carbon Growth Options: Summary Land Transport Power Generation Household Electricity • More Efficient Appliances • Air-Conditioning Units • Refrigerators • Televisions • Lighting Units • Electric Fans • Renewable Energy Technologies • Geothermal • Hydro • Wind • Solar • Cleaner Fossil • Natural Gas • Supercritical Coal • Nuclear • Biofuel blending • Promotion of mass transport like buses and light rail • Motor vehicle inspection system • Alternative fuels for PUVs • CNG buses • Electric tricycles • Electric jeepneys • Vehicle technology improvements • Electric motorcycles • Hybrid buses • Compliance to EU emission requirements
Potential GHG Reductions (2010-2050) Reduction of GHG Emission from 2010 and 2050: By 3,159 MtCO2e (40.8%) all LCGs without Nuclear Power By 4,114 MtCO2e (69.4%) all LCGS with Nuclear
Philippines’ Pathways to Low Carbon Growth: Bottom-up Analysis Strategies and Options
Philippines’ Pathways to Low Carbon Growth: Bottom-up Analysis RESIDENTIAL SECTOR LAND TRANSPORT SECTORPOWER SECTOR National Technical Working Group (NTWG) DENR CCC NEDA (Chair) DOE PSA Technical Support Team DPWH DOTC University of the Philippines National Engineering Center RDTA 7645 Strengthening Planning Capacity for Low Carbon Growth in Developing Asia