Download
1 / 12
120 likes | 236 Views
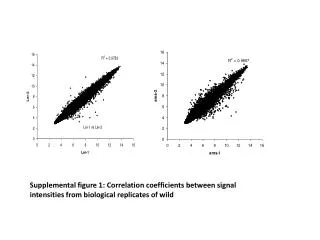
Supplemental figure 1: Correlation coefficients between signal intensities from biological replicates of wild. Supplemental figure 2: GO annotation of genes up-regulated in ams. Supplemental figure 3: GO annotation of genes down-regulated in ams.

E N D
Supplemental figure 1: Correlation coefficients between signal intensities from biological replicates of wild
Supplemental figure 2: GO annotation of genes up-regulated in ams
Supplemental figure 3: GO annotation of genes down-regulated in ams
Supplemental figure 4: GO annotation of metabolism-related genes
Supplemental figure 5: GO annotation of secondary metabolism-related genes
Supplemental figure 6: Genes involved in regulation that are differentially expressed in ams
Supplemental figure 7: Genes involved in kinase pathways that are differentially expressed in ams
Supplemental figure 8: Genes involved in transcriptional regulation that are differentially expressed in ams
Supplemental figure 9: Genes involved in protein trafficking that are differentially expressed in ams
Supplemental figure 10: Genes involved in stress response that are differentially expressed in ams
Supplemental figure 11: Genes involved in ubiquitin and autophagy dependent degradation that are differentially expressed in ams
A B C D E F Supplemental figure 12: Real-time PCR results consistent with microarray data