Download
1 / 38
380 likes | 542 Views
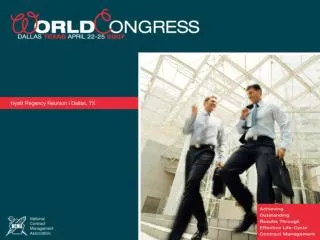
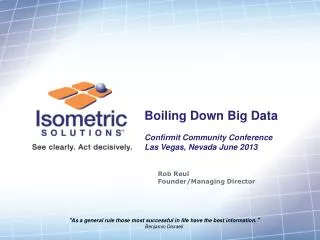
Brendan O’Neil Managing Director IHS Global Insight June 4, 2013. About IHS.

E N D
Brendan O’Neil Managing Director IHS Global Insight June 4, 2013
About IHS IHS (NYSE: IHS) is the leading source of information, insight and analytics in critical areas that shape today’s business landscape. Businesses and governments in more than 165 countries around the globe rely on the comprehensive content, expert independent analysis and flexible delivery methods of IHS to make high-impact decisions and develop strategies with speed and confidence. IHS has been in business since 1959 and became a publicly traded company on the New York Stock Exchange in 2005. Headquartered in Englewood, Colorado, USA, IHS is committed to long-term, sustainable growth and employs more than 6,000 people in more than 30 countries around the world.
The US economy continues its uneven expansion • The economy’s fundamentals are improving, but fiscal policy headwinds will restrain near-term growth. • We expect the federal spending sequester to last through September, taking 0.4 percentage point off 2013 real GDP growth, compared with a no-sequester case. • Monetary policy will remain accommodative into 2015. • Housing markets will continue their resurgence, supporting growth. • Consumers will cautiously increase spending in response to gains in asset values, employment, and income. • The US energy boom is creating jobs, investment, and a competitive advantage. • Real GDP growth will pick up from 2.0% this year to 2.8% in 2014. Upside and downside risks are evenly balanced.
US economic growth by sector (Percent change)
Other key US indicators (Percent change unless noted)
Bottom line for the US economy • The most likely outcome is continued moderate economic growth. • Fiscal tightening is under way, with the expiration of the payroll tax cut, substantial tax increases for high-income households, and spending restraints. • Real GDP growth will pick up in 2014 and 2015, led by strengthening housing markets and business investment. • Upside and downside risks are evenly balanced. • The major downside risks are: • An intensified debt crisis and deepening recession in Europe. • An oil-price shock resulting from supply disruptions in the Middle East. • On the upside, easing credit conditions and a stronger housing-market recovery could spark faster US growth.
Employment: Top Performers 2012 Unemployment Rank State 2012 (% y/y) Top Sector Rate (%) * 1 North Dakota 6.0 Mining 3.2 2 Oklahoma 2.6 Mining 5.1 3 Utah 2.4 Mining 5.6 4 Texas 2.4 Mining 6.2 5 Arizona 2.1 Construction 7.9 Mining 6 Louisiana 2.1 6.9 7 Kentucky 2.0 Prof. & Business 8.0 8 Indiana 2.0 Durables Mfg 8.3 9 Colorado 1.9 Mining 7.5 10 Washington 1.7 Durables Mfg 7.5 * Unemployment rate in December 2012.
Continued modest job growth in 2013 Percent -0.8 to 0.7 0.7 to 1.0 1.1 to 1.4 1.5 to 3.1 2.3%
… Picking up in 2014 Percent 0.9 to 1.4 1.4 to 1.6 1.6 to 1.9 1.9 to 2.7 2.3%
Ohio Forecast Summary (Percent unless otherwise noted)
Unconventional Oil and Gas Plays in North America Enough to satisfy more than 100 years of consumption at current rates
Nearly $5.1 Trillion in Cumulative Capital Investments are Expected to be Made Between 2012 and 2035. Spending will feed into broader the broader supply chain through capital-intensive purchases of heavy equipment, technical skills and services, and information technology.
From 2012 to 2035, the Employment Contribution of the Unconventional Oil and Gas Industry will Double The greatest future job growth will occur between 2012 and 2020 – 3 million jobs by 2020.
Impact of Unconventionals on the US Economy in 2020 Extensive Supply Chain will spread Economic Contribution beyond Producing States… Other Top 10 Top 10 Other Producing States Non-Producing States
Upstream Development Causing a Ripple Effect Through the Economy Employment Contribution in 2020 Upstream unconventional oil and natural gas activity, on average, demonstrates one of the larger employment multipliers. On average direct employment will represent about 20% of all job resulting from unconventional oil and gas activity with the balance contributed by indirect and induced employment.
U.S. Downstream Investment will total $217 billion over next six years
Concern is Motivated by a Variety of Risks, Impacts, and Uncertainties Source of Concerns • Complicating Factors • Priorities unique to each play & community • Local & national debate inform each other • Temptation to confuse the means with the ends • Community preparedness • Politicized confidence in regulators • Jurisdictional conflicts • All pay for the sins of the few • Uneven distribution of benefits ImpactManagement StakeholderUncertainty Drinking Water Local Road & Traffic Public Services Seismicity Scale of Impact Wildlife Air Quality Water Use Macro Climate Change
Rapid increase in local bans and moratoriums • New York • State moratorium since 2010, future unclear • Municipalities: 48 bans, 106 moratoriums, 91 more in development* • Pennsylvania • Regional moratorium in the Delaware River Basin • Municipalities: At least 5 prohibitions, including the city of Pittsburgh • Act 13 passed in February 2012 • Colorado • Longmont • Fort Collins • Ohio • Yellow Springs *As of 2/12/13. Source: fracktracker.org
NY Moratoria Source: fracktracker.org
Dunn County, North Dakota Growing Pains within County Government Services
Tax Department • High ratio of splitting of properties. ( small acreage sales) • Increase valuation of property. (land priced by the square foot) • $50,000 homes in 2006 have sold for $175,000 in 2011. • The property valuations have increased by 19.4% since 2010. • Increased recording because of sales & splits. • Numerous requests for valuation of land. • Creations of subdivisions have increased work load. • Higher request for determination of land ownership.(many old problems arise daily because of the lack of good records) • Department has purchased a service agreement with GIS tracking system. • Huge demand for property for housing and industrial business. (truck parting, RV sites, mobile home parks, small shops, etc.) Source: Dunn County Commissioner Daryl Dukart
Clerk of Court 2006 numbers 2012 estimates • 765 traffic violations • 213 criminal court cases • 205 civil cases • 3 staff employees • Recorders office collected $147,107 • Oil revenue starts to come into the county • 2576 traffic violation • 377 criminal court cases • 298 civil cases • 6 staff employees • Recorders office collected $603,095 • Addition of a new Courtroom • Moved to digital documents Source: Dunn County Commissioner Daryl Dukart
Roads and Traffic 2006 2011 • 1200 miles of road with only 27 paved miles • Very few highly impacted roads from truck traffic • General road maintenance was two to three operation per year on all roads • General road surface materials used are gravel or scoria • Annual cost to maintain was about $1500 per mile • 1202 miles of roads with only 25 paved miles • 330 miles of heavily impacted truck traffic routes (over 100 trucks per day) • Weekly maintenance is required on the 330 miles of highly impacted roads • Cost to maintain impacted roads is $26,000 per mile annually • Materials for road surfacing are getting tighter in supply because of competition from the energy sector Source: Dunn County Commissioner Daryl Dukart
Sheriff’s Department 2006 Q1 2012 • 3 employees • 4 vehicles • Average calls per day 6 • 9 employees • 9 vehicles • Average calls per day 46 • Large amounts of overtime causing stress to employees and equipment • Looking at adding another employee and vehicle on July 1st 2012 • Budget has increased by 300% over three years Source: Dunn County Commissioner Daryl Dukart
States Attorney Office • The States Attorney Office has seen a substantial increase in child abuse and neglect, domestic violence, violent crime, alcohol related offenses, and illegal drugs. • Traffic and alcohol related offenses combined had a substantial increase of 300%. • Financial problems combined with alcohol and illegal drugs appear to the be the gateway for an increase in domestic violence and child abuse and neglect cases. • Most of the increased case load involves individuals who have recently relocated to western North Dakota to pursue employment opportunities in the Bakken. Source: Dunn County Commissioner Daryl Dukart
Bakken Shale Development Impacts Positive: • Created many new job opportunities (many $50,000 plus salary type of jobs ) • Increased salary levels in western North Dakota • Brought additional money to the farm and ranch communities • Creation of many new businesses in the area • Increase sales of trucks, cars, and farm equipment • Has changed our life styles Negative: • Estimated 3200 outside workers drive to Dunn County daily to work • Overload of patrons at restaurants, gas stations, and stores of all kinds • Lack of employees • Detrition of roads because of heavy traffic loads • Traffic everywhere • Total stress on all county departments is greater than we expected • Lack of funds to meet demands Source: Dunn County Commissioner Daryl Dukart
Takeaways • Fiscal and social pressures ride shotgun with prosperity. • There is a structure to environmental regulation at federal, state, and local levels, as well as limitations. • However, some of the boundaries are blurry, and power struggles ensue. • Local authorities are entering the fray, creating a new and highly uncertain dimension of regulation. Discussion Questions • Can industry and environmental stakeholders really work together? • Are Energy Security & Economic Development incompatible Environmental Protection & Health Safety? • Is “political entrepreneurialism” trumping the political process? • What steps can industry take? Collaboration with regulators, communities, NGOs? • What aspects of environmental regulation are most important, and what level of government is responsible? • What are the mutually agreeable best practices to optimize opportunities and minimize risks? • Will lingering uncertainty be the risk premium that deters future investment? • Is disenfranchisement the source of local opposition?
Thank you Brendan O’Neil Managing Director IHS Global Insight brendan.oneil@ihs.com