Download
1 / 20
200 likes | 449 Views
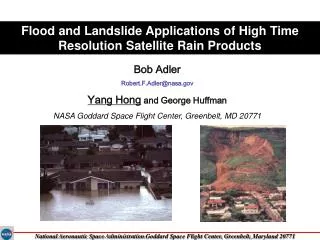
National Aeronautic Space Administration Goddard Space Flight Center, Greenbelt, Maryland 20771. Flood and Landslide Applications of High Time Resolution Satellite Rain Products. Bob Adler Robert.F.Adler@nasa.gov Yang Hong and George Huffman

E N D
National Aeronautic Space Administration Goddard Space Flight Center, Greenbelt, Maryland 20771 Flood and Landslide Applications of High Time Resolution Satellite Rain Products Bob Adler Robert.F.Adler@nasa.gov Yang Hong and George Huffman NASA Goddard Space Flight Center, Greenbelt, MD 20771
Global Monitoring/Warning Systems for Floods and Landslides • Motivation: • Floods and landslides associated with heavy rainfall impact more people globally than any other type of natural disaster • • Detecting or forecasting such events globally is important to understand the causative processes, for mitigation, and potentially for warning • Insufficient in situ data, long delays in data transmission and absence of data sharing in many trans-boundary river basins • • Recent satellite remote sensing data sets of precipitation and land surface characteristics (e.g., elevation, soil conditions, vegetation) are now available for research and potential applications in this area. • In this talk: • A framework for global flood estimation • A global landslide forecast technique--in early test phase
A Framework For Global-scale Flood Detection System Flood Inundation Map - Pi(t) Module. 3: Model Qi Qi Qk Iii(t) Oik(t) Rain-Infiltration Partitioning Grid-based Water Balance Model Basin-based Water Balance Model Module. 2: Surface Soil Parameters Routing Parameters Basin Parameters Land Surface Characteristics DEM, Topography, Slope gradient, Flow Direction, Flow Accumulation, River Network, watershed, Soil Property, Soil Moisture, Hydrological Soil Groups, Land Use, Vegetation cover, Field Capacity, Profile Water Content, Saturated Hydrological Conductivity Module. 1: Input TRMM Multi-satellite Precipitation Analysis (TMPA) Implementation interface TRMM 3-hour real-time Cell-to-Cell Flow Routing Basin/river network Flow Accumulation Stream Flow Model Hydrograph Output/Decision Support System WEB: 3-h update Validation News Report Inventory Satellite Inundation Information
Module 1:Quasi-global rainfall Tropical Rainfall Measuring Mission (TRMM) TRMM Multi-satellite Precipitation Analysis (TMPA) [3B42] Real-time update every 3-hour at http://trmm.gsfc.nasa.gov TMPA uses polar-orbit microwave satellites (NOAA, DoD, NASA) and geosynchronous IR satellites, all calibrated by TRMM 7 day accumulation Recent Typhoon-related heavy rains over Philippines
From Space-borne Rainfall to Flood Potential Maps http://trmm.gsfc.nasa.gov Simple rain amount thresholds: 24 hrs ending 28 Oct. 2005 0000GMT Threshold: 35 mm NEWS STORY: More than 100 die in India floods More than 100 people have died in five days of heavy rains in the southern Indian states of Tamil Nadu and Karnataka, officials say. More than 50,000 people have been evacuated from their homes in affected areas of Tamil Nadu. Thousands of people have been displaced and air, rail and road services hit. From web site text page: 131 mm MADRAS 214 mm NELLORE 234 mm CUDDAPAH 336 mm (13”) TIRUPATHI 24 hr rainfall
Potential Flood Areas from TRMM Web Site 24 hrs ending 0300 GMT 19 Oct. http://trmm.gsfc.nasa.gov
(a) USGS GTOPO30 DEM (1km) (b) NASA SRTM DEM (30- or 90-m) Module 2: Development of Hydrologic Parameters at global scale Geospatial Database Topography Parameters: SRTM--Shuttle Radar Topography Mission Puerto Rico SRTM DEM (30-meter) Derived Slope (degree)
Module 2: Development of Hydrologic Parameters at global scale Level II Derived Flow Routing Parameters Global River Network Global Slope (degree) Flow Accumulation (upper stream) Flow Length (cell to watershed outlet)
Module 2: Development of Hydrologic Parameters at global scale Geospatial Database (not from satellite information) (c) Sand (%) (d) Silt (%) Soil Parameters: (a) Soil Texture (b) FAO Soil Type Classification (b) Clay (%) Land Use/Vegetation Information from NASA MODIS
Rainfall-infiltration Partitioning (Spatio-temporal variation) Curve Number Approach Spatial variation: each cell has its own CN Time-variant: Antecedent Precipitation Index Fixed CN=75 Various NAPI CN=95 CN=85 CN=75 ….. CN=40 Surface Runoff Generated by uniform Rainfall (=100mm/hr) at normal moisture condition
Cell-to-Cell Flow Routing Cell-based Water Balance Model Rain-Infiltration Partitioning Pi(t) Grid-based Water Balance Model Basin-based Water Balance Model Pi(t) Routing Parameters Cell-based: Slope, soil type, Hydrologic conductivity, Porosity, Field Capacity, effective depth of soil column, flow direction, velocity, hydraulic radius, roughness coefficient, antecedent precipitation index; Watershed-based: flow length, area, flow accumulation, concentration time, flow time Qi Qi Qk Qi Qi Qk Iii(t) Oik(t) Iii(t) Oik(t) Module 3: Distributed Macro-scale Hydrological Model Step I: Rainfall-infiltration Partitioning (Distributed and Time-variant) Step 2: Flow Routing using Macro-scale Cell-to-Cell Algorithm Step 3: Grid Point Hydrographs--Flood Inundation Mapping Constraints: computational efficiency, simplification of channel and hydraulic parameterization
Case Study: Yangtze River flooding in Sept. 2005 Basin Area: 1,722,155 km2 Population: 386 million Water depth exceeding threshold= flood Lower Basin Sept 01----- 05 (day) Yangtze Basin-averaged Hydrograph for 2005 Basin Rainfall (mm) Water Depth [lower basin] (mm) Verified by Dartmouth Flood Archive and News: Sept 01-05, 2005 China – Typhoon Talim caused flooding and landslides. 129 dead, 30 missing. 1.84 million people evacuated. 62,000 houses collapsed, US$960 million damages.
Preliminary Case Studies Yangtse River Basin Cell-based Flow Routing Grid (118.875oE, 31.125oN) A grid-based hydrograph Cell-based Hydrograph Cell Rainfall (118.875oE, 31.125oN) Cell Water Storage/Depth (mm) after Flow Routing 2005 Day of Year
Landslides/Mudslides/Debris Flow • Landslides are one of the most widespread natural hazards on Earth, responsible for thousands of deaths and billions of dollars in property damage every year. • Rainfall is the primary causative factor. • Currently, no system exists at regional or global scale to detect heavy rainfall that may trigger landslides. Landslides Death Toll Entire village buried.
Global Rainfall-induced Landslide Forecast System When Topography Morphology DEM, Slope, Aspect Curvature, Concavity Rainfall Trigger Intensity-Duration NASA TRMM-based Where Real-time Rainfall Estimation Soil Property Geology Hydrology How big Sand, Foam, Silt, Clay Lithological makeup Soil Moisture, FD, FA Land Cover Risk Shrub, barren, builtup Slope-Stability Sliding Probability Damage Hierarchical Decision Tree Classification Soil Moisture Decision Making Inventory Data Detection/Warning Surface controlling factors Landslide Susceptibility Hong et al., IEEE TGRS (accepted)
Topography Morphology DEM, Slope, Aspect Curvature, Concavity Soil Property Geology Hydrology Sand, Foam, Silt, Clay Lithological makeup e.g., Soil Moisture Land Cover Shrub, barren, urban Landslide Susceptability Map Surface controlling factors Percentage of Grid Boxes in Each Category Landslide Susceptibility Category -1: Water Bodies 0: Permanent Snow/Ice 1: Very Low Susceptibility 2: Low Susceptibility 3: Moderate Susceptibility 4: High Susceptibility (yellow) 5: Very High Susceptibility (orange) Hong et al., Submitted to J. of Natural Hazards
(a) (b) Hour Day Influence of Rainfall Characteristics on the Timing and Occurrence of Landslides Note that bars are the rainfall intensity and star denotes the timing of landslide occurrence. Philippines Landslide and TRMM Rainfall Accumulation Philippines Feb 8-17, 2006 1500 Deaths Hong et al., Submitted to GRL
Rainfall Trigger Intensity-Duration Sliding Probability Decision Making Inventory Data Global Rainfall-induced Landslide Forecast System Rainfall Map Intensity-Duration Susceptibility/ Landslide Warning TRMM Near Real-Time Rainfall at location 76.875 W, 4.125 N, April 13, Columbia 1) the last 24 hour rainfall accumulation > 103mm 2) The Susceptibility Map shows high or very high susceptibility News Report: 13 Apr 2006, At least 34 people missing in Colombian mudslide
Summary and Future Work NASA TRMM-based Global-scale Flood/landslide System • NASA-based data sets of near real-time precipitation observations and land surface characteristics are being combined to develop a Flood and Landslide Monitoring Systems. • Next: • Evaluation/implementation of the first-cut, experimental systems for user feedback (January 2007 is goal to have real-time experimental systems running in real-time); • Flexible Module Structure: open for new component plug-ins for testing; • Use of multiple precipitation estimates for ensemble forecasts; • Use of NWP model(s) precipitation forecasts to lengthen forecast applicability
Watershed-based VIC Simulation (1998-1999): La Plata Basin 5000+ Water basins derived from DEM The La Plata Basin Credit: U. of Washington Lettenmeier Group