Download
1 / 19
190 likes | 213 Views
Explore dynamic models for studying space radiation effects to assess device risks, flux variations, and time estimation. Understand particle flux lifetimes, anomalies, and event-driven variations using probabilistic and phenomenological models. Evaluate radiation belts for risk estimation.

E N D
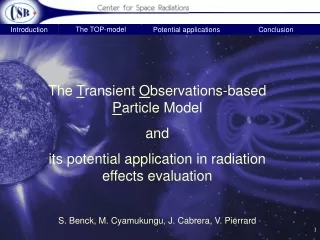
The Transient Observations-based Particle Model and its potential application in radiation effects evaluation S. Benck, M. Cyamukungu, J. Cabrera, V. Pierrard
The Sun-Earth system Magnetosphere Radiation Belts Solar wind • The radiation belts • From static empirical models to dynamic models - semi empirical models: numerical solution of a diffusion equation; the observations are the boundary conditions to these models • empirical model: based on the observation of transient particle fluxes • The advantage of dynamic models • facilitate the investigation of the physical processes involved in the flux variations • to complete radiation effects evaluation • risk evaluation • estimation of the time fraction during which a device will be disabled due to exceeding fluxes
The observation of transient particle fluxes was found to be a convenient approach to study the dynamic of the space radiation environment. This method actually includes the following activities: • The measured steady state particle fluxes • Measurements of particle flux lifetimes as a function of energy, position and pitch angle • Analysis of the event-driven flux variations • First step: The development of a probabilistic model based on probability distribution functions of the flux variations. • Second step: The development of a phenomenological model of the event-driven flux variations as a function of geomagnetic indices and/or solar wind parameters. • Third step: Physics of anomalies (drivers - effects).
1 Jan 2004 00:00:00 1 Jan 2004 00:20:00 1 Jan 2004 00:40:00 1 Jan 2004 01:00:00 • The measured steady state particle fluxes Steady state fluxes are measured during a long period of low geomagnetic activity (from 1 May - 17 July 2004). They provide lower limit of particle fluxes at a given position and can be used for instrument cross-calibrations. Steady state fluxes at a given position in space are very stable (likely to be only affected by solar cycle and secular variation of the geomagnetic field).
Measurements of particle flux lifetimes In general, the steady state flux level is reached after determined lifetimes which only depend on particle energy, position in space and particle pitch angle. Cases are observed in which enhanced fluxes do not decay according to the characteristic lifetime: investigation of such behaviours reveals itself to be a powerful tool for the identification of the mechanisms which affect space particle flux variations. Electron Decay time constants as a function of L for different electron energies as deduced from DEMETER and SAC-C data. (Benck et al. Ann. Geophys., 28, p.849, 2010)
Analysis of of the event-driven flux variations Probability distribution function for the flux variations at a given position for a given energy bin Cumulative distribution function for the flux variations at a given position for a given energy bin Probability distribution function for the time interval (time measured between the instant of Dst minimum and instant of flux maximum) use of the mean value
time evolution of the flux (in cm-2/sr-1/s-1) for E=0.5-0.7 MeV represented in geographic coordinate system for LEO orbit (700 km altitude) • simulation time = 150 days • time resolution = 3 days • storm occurrence deduced from the storm waiting time probability distribution (Poisson distribution with Tw=12.5 days for solar max) • time interval between storm onset and start of flux increase (at Dstmin) = 1.35 days • time between start of flux increase and moment of maximum flux reached = mean value from PDF • flux variation = random (seed 3) from CDF • starting flux value = steady state no dynamics for SAA
time evolution of the flux (in cm-2/sr-1/s-1) for E=0.5-0.7 MeV represented in geographic coordinate system for LEO orbit (700 km altitude) • simulation time = 150 days • time resolution = 3 days • storm occurrence deduced from the storm waiting time probability distribution (Poisson distribution with Tw=12.5 days for solar max) • time interval between storm onset and start of flux increase (at Dstmin) = 1.35 days • time between start of flux increase and moment of maximum flux reached = mean value from PDF • flux variation = random (seed 3) from CDF • starting flux value = steady state Animated
0.5 mm Al Si Average differential flux for a LEO orbit (700 km altitude) D TOP-model ___ AE8max AE8max: 30% lower Hypothetic case: Simulation of the electron dose absorbed in a small silicon volume shielded by a finite aluminum slab of 0.5 mm thickness for a 3 years mission : TID electron AE8 = 11 krad (Shieldose –2) TID electron TOP = 16 krad
Accumulation of the electron dose (rad) during 150 days ___ constant dose rate ___ variable dose rate seed 1 seed 3 ~1 krad • risk evaluation • ELDRS and mixed dose rate Dose accumulated per half day
Instant dose rate in rad/h as a function of position and time Mean dose rate in rad/h as a function of position seed 3
The TOP-model can be combined with measurements from an energetic particle telescope (EPT) to perform space weather forecasting: • - EPT provides real-time particle fluxes (In-flight particle and energy discrimination) • - The TOP model provides the lifetime values • Forecast of quiet conditions may be provided up to 7 days in advance. • - Useful for fluence/flux - driven effects (charging, CCD blurring) • Estimation of the time fraction during that a device will be disabled due to exceeding fluxes
Dynamic radiation belt models allow: • to further define the physical processes involved in particle flux variations • to give a more realistic prediction of the fluxes encountered in orbit and their resulting dose accumulation: • The dose rate is very variable within a given mission; this may change the risk evaluation for dose rate sensitive devices • Predict the probability of occurrence of steep dose enhancements per unit time (i.e. for human radioprotection) • Provide an estimation of the time fraction during which a device will be disabled due to exceeding fluxes • Extension of the model to higher altitudes
extension of the database to complete the coverage of the radiation belts Themis/SST fst CRRES/MEA Df, t SACC/ICARE fst, Df, t DEMETER/IDP Df, t SAMPEX/PET fst, Df, t
High acquisition rates due to digital operation mode (peak flux 107 cm-2 sr-1 s-1) acquire data in environments where most instruments saturate solar max declining t~180 d t~45 d 330 days 70 days flux saturation for SAC-C/ICARE in the centre of the SAA (L=1.4-1.6, B=0.16-0.18) peak flux ~3 106 cm-2 sr-1 s-1
Mean dose rate in rad/h as a function of position seed 1 seed 3