Recent (selected) results from CloudSat and the A-Train
630 likes | 794 Views
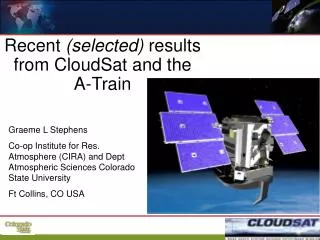
Recent (selected) results from CloudSat and the A-Train. Graeme L Stephens Co-op Institute for Res. Atmosphere (CIRA) and Dept Atmospheric Sciences Colorado State University Ft Collins, CO USA. Brief introduction to the A-Train and CloudSat Example of a few core products

Recent (selected) results from CloudSat and the A-Train
E N D
Presentation Transcript
Recent (selected) results from CloudSat and the A-Train Graeme L Stephens Co-op Institute for Res. Atmosphere (CIRA) and Dept Atmospheric Sciences Colorado State University Ft Collins, CO USA
Brief introduction to the A-Train and CloudSat Example of a few core products Highlights from the emerging ‘enhanced’ precipitation products Arctic Clouds (summer and winter) Model evaluation Warm rain processes Tropical storm data base Outline
Mission Overview • CloudSat launched April 2006; • Completed prime mission in Feb 08. • Approved for extended mission through FY11. • ROSES-sci team June 2007 • Flies in on-orbit formation with the A-train satellites • First release to community Jan07 - All products of prime mission now available • Maneuvers are planned and executed by the orbit analysts at the KAFB RSC USAF conducts operations out of the RSC at Kirtland AFB in Albuquerque, NM. First $5M was STP contribution to ground system development costs. Colorado State University, Fort Collins, processes science data. Near-realtime (3-8 hour) Level 1 data latency USAF conducts operations out of the RSC at Kirtland AFB in Albuquerque, NM
1.Formation with the A-Train 2.The Cloud Profiling Radar (CPR) • Nadir pointing, 94 GHz radar • 3.3s pulse 480m vertical res, over- sampled at ~240m • 1.4 km horizontal res. • Calibration better than 2 dBZ • Sensitivity ~ -28 dBZ (-30 dBZ) • Dynamic Range: 80 dB 500m ~1.4 km A brief overview Two main components of design demonstrated post launch Hardware continues to operate with nominal performance
The Geoprof products Radar 2B-Geoprof Radar+lidar 2B geoprof-lidar Difference
The 2B-CWC Ice product Major ‘greenhouse’ contribution Important in precipitation processes Important to storm development and convection CloudSat IPCC FAR The first real ‘authoritative’ measure of total ice
2B-FLXHR 80N-S global averag
Cs min Cs max Oceanic precipitation results Precipitation incidence and accumulation as a function of cloud top (min) height
Incidence by highest cloud top height
Incidence by lowest cloud top height
Lowest cth Highest cth
Model-evaluation studies Instrument simulators in forecast, climate & CRM models- Key development for CFMIP II New diagnostic tools for analyzing the joint statistical properties of clouds and precipitation
B A Case study example : 26 February 2007 • Analysis chart valid at 12 UTC • CloudSat overpass at ~14:15 UTC Bodas-Salcedo et al, 2008
Less IWC Spurious drizzle Deep evaporation zone A B
CloudSat MetUM N320L50 Global histograms: 2006/12 – 2007/02 Frequency of occurrence Frequency of occurrence Strong dependence of N0 with T Height / km Height / km Two regimes. Drizzling or not drizzling cloud? Reflectivity / dBZ Reflectivity / dBZ Occurrence of Z > -27.5 dBZ Occurrence of Z > -27.5 dBZ Height / km Height / km Lack of mid-level cloud Latitude Latitude
CloudSat MetUM N320L50 North Atlantic histograms: 2006/12 – 2007/02 Reasonable ice microphysics? Two regimes – drizzle / no drizzle? Cloud top height very well captured Lack of congestus Less hydrometeors?
CloudSat MetUM N320L50 Tropical west Pacific histograms: 2006/12 – 2007/02 Reasonable ice microphysics? Evaporating ice – or T dependence in convective cloud ice fraction? Lack of mid-level cloud Lack of non-drizzling low cloud
Arctic Cloudiness • summer cloudiness and the sea ice loss • (collab with Kay and Gettelman (NCAR) • winter cooling and an aerosol-precipitation dehydration? • (Collab with U Montreal - Blanchet and colleagues)
The radiation balance of the Arctic Minimum Extent Time Series New Record Minimum - Sept. 2007 Kay et al., 2008
The A-train provides a unique view of Arctic clouds. DJF Low Cloud Maps Warren (surface obs.) ISCCP D2 (infrared) 2B-Geoprof-lidar
Kay et al., 2008 A-train data reveal dramatic cloudiness reductions, T increases, and RH decreases associated with the 2007 circulation anomalies.
The 2007-2006 radiation differences could melt ~0.3 m of sea ice or increase ocean mixed layer temperatures by ~2.4 K.
Arctic Low Cloud Fraction Comparisons: DJF JJA CloudSat/CALIOP (2006) IPCC AR4 Climate Model (NCAR’s CCSM3 climatology)
Arctic Winter Cooling AVHRR Arctic summer 20 yr temperature trends (C/year) AVHRR Arctic winter 20 yr temperature trends (C/year) The artic is warming but the winter-time arctic has been cooling Arctic is heavily polluted by SO2, particularly in the winter The SO2 has been shown to inhibit ice particle nucleation Regions of strongest winter cooling coincide with regions of highest pollution The hypothesis is that aerosol affected precipitation serves to dehydrate the atmosphere Wang et al., 2003
Thin Ice Clouds type 1 Thin Ice Clouds type 2 Reduced Greenhouse * * * * * Low Acid Aerosols Hydrophilic * * * * * * * * * * * * * * * * * * * * * * Increased Greenhouse Dehydration-Greenhouse Feedback (DGF) Clouds forming on acidic ice nuclei precipitate more effectively, dehydrate the air, reduce greenhouse effect and cool the surface Slow Cooling Process adiabatic cooling and IR lost * * * * Acid Aerosols * * * * * * Less H2O vapour Colder Warmer Ice and Snow layers Cold Ice and Snow Surface
Arctic case : January 19th, 2007 (mg m-3) 0.01 1.00 2.00 8.00 12.00 20.00 (km-1 sr-1) 0.0005 0.0010 0.0015 0.0045 0.0090
Thin Ice Cloud type 1 low [aerosol] (pristine),small crystalsslow sedimentation A-Train observations reveal much about the cloud systems of the Arctic winter Thin Ice Cloud type 2b Forms slowly over many days in cold high [aerosols] (acidic),large ice crystals and fast sedimentation Polluted PBL
Elementary growth processes When droplets grow by vapor deposition, the mass increases but not the number concentration When coalescence occurs, big drops grow by collecting little drops - that is the total droplet number concentration is reduced but the total mass of water doesn’t change
The observables Ze: layer-mean radar reflectivity Fixed N Re6 Fixed w, Re3 (Masunaga et al., 2002a,b; Matsui et al., 2004) The relationships Honing in on the coalescence Process in warm, oceanic clouds Suzuki and Stephens, 2008
N=const: condensation w=const: coalescence Suzuki and Stephens, 2008
‘Heavy’ Rain region (R > 0.1 mm/hour) Light Rain region (R < 0.1 mm/hour)
CloudSat tropical cyclone data base Examples of MODIS and CloudSat data corresponding to three eye/near eye radar intersections
Two main activities: In partnership with Naval Research Labs, development of a new data base resource for studying tropical storms and the influence of the environment on storm structure Use of new cloud radar observations with other A-Train data as a new opportunity to test theories of hurricane storm intensification. Hurricane intensity research Featured on the front cover of IEEE GSRL; Luo et al., 2008
TC Database Characteristics Located at http://www.nrlmry.navy.mil/archdat/tropical_cyclones/CPR_TC_Intercepts/ The data base consists of 2,423 TC overpasses through February 2008. For each storm overpass: (A) Storm specific variables latitude, longitude, mslp, max winds, storm center SST, 850-200 mb wind shear (B) Radial/Azimuthal Data Brightness Temperature (MODIS 11 um) MODIS Cloud top height, pressure and temperature AMSR-E SST, Wind Speed, LWP/IWP, Precipitation (C) Numerical Weather Prediction Analyses (Naval Operational Global Atmospheric Prediction System (NOGAPS™) Temperature and Moisture Profiles Surface Winds (D) CloudSat CPR Data GEOPROF Radar Reflectivity Profiles
Storm structure analysis Shown are composite radar reflectivity profiles as a function of radial distance from storm center as a function of SST and wind shear Storm structure weakens with increased shear Storm structure strengthens with increased SST Work in progress
Summary • The ability to observe clouds, aerosol and precipitation jointly and in placing these observations in the context of the environment is beginning to provide new insights on: • Processes of cloud and precipitation formation • Aerosol effects on these processes • Effects of clouds on the radiation processes and energy balance • These observations also provide important new evaluation of weather and climate prediction models
Elementary growth processes When droplets grow by vapor deposition, the mass increases but not the number concentration When coalescence occurs, big drops grow by collecting little drops - that is the total droplet number concentration is reduced but the total mass of water doesn’t change
The observables Ze: layer-mean radar reflectivity Fixed N Re6 Fixed w, Re3 (Masunaga et al., 2002a,b; Matsui et al., 2004) The relationships Honing in on the coalescence Process in warm, oceanic clouds Suzuki and Stephens, 2008
N=const: condensation w=const: coalescence Suzuki and Stephens, 2008
‘Heavy’ Rain region (R > 0.1 mm/hour) Light Rain region (R < 0.1 mm/hour)
Aerosol forcing of climate A state of much confusion - fundamental to all aspects is the water budget of clouds - including the state of precipitation
Aerosol indirect effects using atrain obs - Lebsock et al., 2008 Twomey effect? Precipitation For the first time, we are able to observe all aspects of clouds that affect their albedo - as such we perhaps can say there appears to be a global Twomey effect and a correlation between precipitation probability and aerosol
aerosol effects? Polluted: AI > 0.1 Pristine: AI < 0.1
CloudSat 30S-30N Stephens and Wood, 2007