Download
1 / 27
270 likes | 290 Views
Explore the advancements in MODIS Snow and Sea Ice products, including validation activities, future enhancements, and outreach. View daily snow maps, sea ice extent, and learn about IST mapping using MODIS data.

E N D
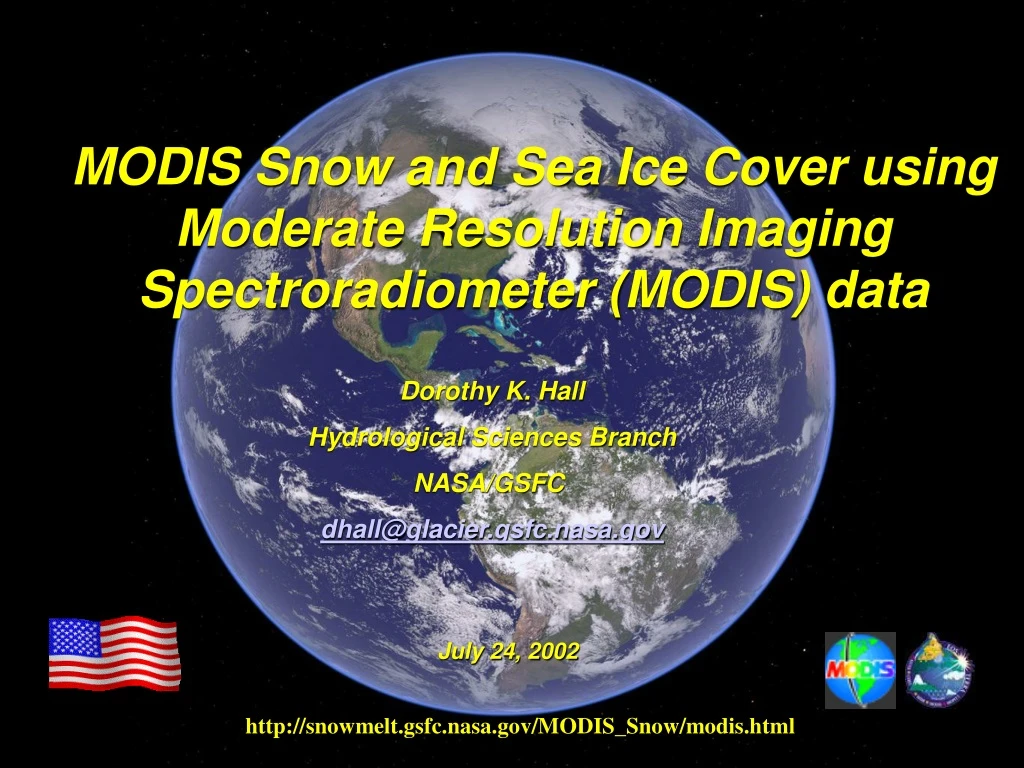
MODIS Snow and Sea Ice Cover using Moderate Resolution Imaging Spectroradiometer (MODIS) data Dorothy K. Hall Hydrological Sciences Branch NASA/GSFC dhall@glacier.gsfc.nasa.gov July 24, 2002 http://snowmelt.gsfc.nasa.gov/MODIS_Snow/modis.html
Others Involved in the Project Vincent V. Salomonson/NASA/GSFC, Team Member George A. Riggs/SSAI Team Leader(algorithm development, science, programming) Igor Appel/SSAI (works with Vince on FSC for 500-m product) Kimberly A. Casey/SSAI (Web site, sea ice) Janet Y. L. Chien/GSC (image processing, validation) Nicolo E. DiGirolamo/SSAI (programming) Andrew G. Klein/Texas A&M (snow albedo) Hugh W. Powell/GSC (programming)
Outline Snow Products Recent and future enhancements Validation activities & status Sea Ice Products Validation activities & status Future validation efforts Outreach Acitivity - SVS Animation
Snow Products Archived and Distributed by NSIDC http://nsidc.org Daily 500-m resolution swath Daily 500-m resolution tile 8-day composite 500-resolution tile Daily climate-modeling grid (CMG) 8-day composite CMG Snow albedo – planned for fall 2002 Fractional snow cover for 500-m maps - future
MODIS climate-modeling grid (CMG) daily snow maps at 0.05° resolution (~5.6 km at the Equator)
40-50% 51-60% 61-70% 71-80% 91-100% Not snow Cloud 81-90% The Daily CMG maps show fractional snow cover from 40 - 100% in each pixel
Eight-Day Composite Global CMG MODIS Snow Map March 6-13, 2002
A thermal mask (>277 K) was instituted in order to eliminate spurious snow cover Before thermal mask After... 14 Nov 2000 Confusion with sand and clouds and some water bodies is eliminated in Florida and the Bahamas
False-color MODIS image Snow map Snow map Bands 1, 4, 6 Conservative cloud mask Liberal cloud mask Cloud Masking – Mid-Western U.S. November 29, 2001 Missouri River The liberal cloud mask result, on the right, results in a 75% increase in snow being mapped, and an 18% decrease in the amount of clouds mapped.
Snow on both maps Snow on MODIS maps only Snow on IMS maps only Clouds from MODIS maps March 1, 2002 MODIS-IMS Daily Difference Maps Bands 1,4,3 NOAA Interactive Multisensor Snow and Ice Mapping System (IMS) map showed snow cover in North Dakota and Minnesota and MODIS shows no snow
Snow on both maps Snow on MODIS maps only Snow on IMS maps only Clouds from MODIS maps March 5, 2002 MODIS-IMS Daily Difference Maps IMS maps showed more extensive snow cover in Missouri and Oklahoma than did the MODIS maps
For this 8-day period, the MODIS and IMS maps agree more than 80%of the time. The IMS maps consistently map more snow cover than do the MODIS maps.
Snow on both Snow on MODIS only Snow on SSMI only Clouds from MODIS MODIS-SSMI Difference Maps
Results of the MODIS-SSM/I difference maps for the 2001-02 winter
Interannual Comparisons (8-day composite CMGs show maximum snow cover for the period)
Data Assimilation Modeling MODIS snow daily CMGs are used to correct the modeled snow output in the global Land Data Assimilation System (LDAS) Still in testing mode, but it looks very promising
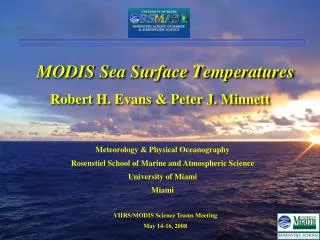
MODIS Sea Ice Maps • Sea ice extent • based on NDSI • Ice-surface temperature (IST) • split-window technique using MODIS bands 31 and 32 developed by Jeff Key and others
MODIS Sea Ice Data Products • Archived and Distributed by NSIDC • http://nsidc.org • Global, daily and 8-day composite 1-km resolution sea ice cover/IST maps • Global daily climate-modeling grid (CMG) products at ~4-km resolution beginning late-fall 2002 • Global 8-day composite Climate-Modeling Grid (CMG) products at ~4-km resolution beginning late-fall 2002
MODIS IST from an area near the tip of the Antarctic Peninsula April 16, 2002 (fall) navy blue = open water, temperatures greater than 271.5K Sea ice surface temperatures ranging from 271.5K (blue) – 233K (yellow) in this color bar cloud ice floe MOD02HKM MOD29 IST
MODIS IST map acquired in the Arctic Ocean west of Greenland April 1, 2002 Greenland cloud MOD02HKM MOD29 IST
NOAA/NOS CO-OPS Tide Station Prudhoe Bay, AK (NOAA / National Ocean Services Center for Operational Oceanographic Products and Services) Latitude 70° 24.0’N Longitude 148° 31.6’W http://www.co-ops.nos.noaa.gov/co-ops.html
MOD29 Sea ice surface temperature, 1km March 29, 2002 (Day 088) 21:45 UTC Pixel nearest tide station coordinates => 248.12 K Tide Station Data: Air temperature at 2200 UTC -24.9º C, or 248.1 K Water temperature at 2200 UTC 6.2º C, or 279.2 K MOD29 Sea Ice Surface Temperature (IST) Map Air temperature = 248.3 K IST of pixel nearest tide station = 248.1 K Tide Station March 29, 2002 2200 UTC North Slope of Alaska
Date Time (UTC) MODIS IST (K) P.B. Tide Station Air Temperature (K) Difference (K) 03 Mar 2002 2100 245.0 244.7 0.3 29 Mar 2002 2145 248.1 248.3 0.2 30 Mar 2002 2230 250.0 248.5 1.5 31 Mar 2002 2135 251.5 251.2 0.3 IST Validation Summary Prudhoe Bay, Alaska, Tide Station
Future Validation Opportunity - Sea Ice Don Cavalieri/NASA/GSFC, Jim Maslanik/Univ. of Colorado, Matthew Sturm/CRREL, and others Aircraft and Field Experiment March 2003 Wallops P3 based in Fairbanks AMSR, MODIS, field measurements on sea ice IR surface temperature from the aircraft
Product Validation Status Snow and sea ice cover products are validated Ice surface temperature product is Provisional (or Validated at Stage 1 according to the new MODland model)