Download
1 / 11
110 likes | 187 Views
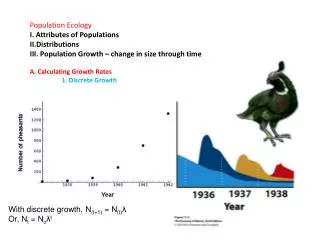
Population Distributions. What About Representing Population Frequencies?. Relative Frequencies Although you usually cannot find the absolute frequency for each score in a population, you very often can obtain relative frequencies Smooth Curves

E N D
What About Representing Population Frequencies? • Relative Frequencies • Although you usually cannot find the absolute frequency for each score in a population, you very often can obtain relative frequencies • Smooth Curves • When a population consists of numerical scores from an interval or a ratio scale, it is customary to draw the distribution with a smooth curve instead of the jagged, step-wise shapes that occur with histograms and polygons
The Normal Distribution Image from wikipedia
How Do We Describe Distributions That Are Not Normal? • A symmetrical distribution is one in which it is possible to draw a vertical line through the middle so that one side is the mirror image of the other • A skewed distribution is on in which the scores pile up toward one end of the scale and taper off gradually at the other end • A positively skewed distribution is on in which the tail points toward the positive end of the distribution. Therefore there are “extra” scores on the higher side • A negatively skewed distribution is on in which the tail points toward the negative end of the distribution. Therefore there are “extra” scores on the lower side
More Non-Normal DistributionsKurtosis • “For symmetric unimodal distributions, positive kurtosis indicates heavy tails and peakedness relative to the normal distribution, whereas negative kurtosis indicates light tails and flatness. Many textbooks, however, describe or illustrate kurtosis incompletely or incorrectly.” (p. 292) • The three most common mistakes made in texts talking about kurtosis are: • Kurtosis is defined solely in terms of peakedness, with no mention of the importance of tails • The relation between the peak and the tails of a distribution with excess kurtosis is described or illustrated incorrectly • Descriptions and illustrations of kurtosis fail to distinguish between kurtosis and variance • From DeCarlo, L. (1997). On the Meaning and Use of Kurtosis. Psychological Methods, 2(3), 292 – 307.
Kurtosis Continued • Positive kurtosis indicates both heavy tails and a high peak, with narrow shoulders in a distribution. • Negative kurtosis indicates light tails and a short peak, with broad shoulders in a distribution.
Kurtosis or Not? The dashed lines indicate a normal distribution, while the solid lines indicate distributions characterized by kurtosis (positive on the left, and negative on the right). These curves all have normal distributions with different variances. From DeCarlo (1997)
Kurtosis Continued • The conventional way of measuring kurtosis is through use of β2 • For the normal distribution, the value of β2 is 3 • To remain consistent with measures of skew (for which the normal is 0), SPSS subtracts 3 from the β2 value. • SPSS will report a β2 value of 0 for a normal distribution • For a distribution with positive kurtosis (that is one which is leptokurtic) • β2 > 0 • For a distribution with negative kurtosis (that is one which is platykurtic) • β2 < 0
Checking for Skew or Kurtosis • SPSS suggests the use of skewness and kurtosis statistics in conjunction with their standard errors. Their (SPSS’) rule of thumb is if the ratio of the statistic to the standard error is two or greater, the distribution may be non-normal in shape. This rule of thumb applies for both skweness and kurtosis statistics.