Download

1 / 16
160 likes | 214 Views
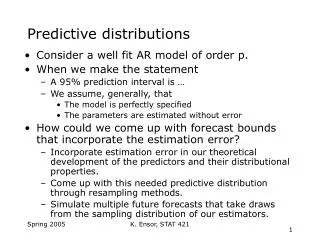
Explore key concepts, probability models, discrete and continuous distributions, and examples like Beta and Lognormal distributions in microeconomics. Get insights into income modeling and empirical estimation methods.

E N D
Distributions MICROECONOMICS Principles and Analysis Frank Cowell August 2006
Purpose • This presentation concerns statistical distributions in microeconomics • a brief introduction • it does not pretend to generality • Distributions make regular appearances in • models involving uncertainty • representation of aggregates • strategic behaviour • empirical estimation methods • Certain concepts and functional forms appear regularly • We will introduce basic concepts and some key examples
Ingredients of a probability model • The variate • could be a scalar – income, family size… • Could be a vector – basket of consumption, list of inputs • The support of the distribution • The smallest closed set W whose complement has probability zero • A convenient way of specifying clearly what is logically feasible (points in the support) and infeasible (other points). • Distribution function • Captures the probability concept in a convenient and general way • Encompass both discrete and continuous distributions.
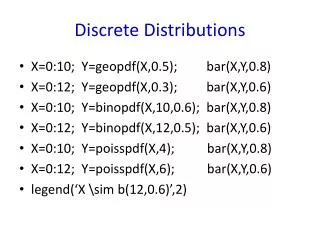
Discrete and continuous • Discrete distributions • Wis usually a finite collection of points • Wcould also be countably infinite • Continuous distributions • for univariate distributions S is usually an interval on the real line… • … could be bounded or unbounded • for multivariate distributions usually a connected subset of real space • if F is differentiable on W then define the density functionf as the derivative of F • Take some particular cases: a collection of examples
Some examples • Begin with two cases of discrete distributions • where the variate can take just one of two values • where it can take one of five values. • Then two simple examples of continuous distributions with bounded support • The rectangular distribution – uniform density over an interval. • Beta distribution – a single-peaked distribution. • Finally a standard example of a continuous distribution with unbounded support: • Lognormal distribution
Examples 1 & 2 • Discrete distributions • W is the set {x0, x1, …, x-1} • is number of elements in the support • assumed positive, finite • Example 1 • = 2. • Probability p of value x0; probability 1–p of value x1. • Example 2 • = 5 • Probability pi of value xi, i = 0,...,4.
F: Example 1 • Suppose of x0 and x1 are the only possible values. • Below x0 probability is 0. • Probability of x ≤ x0is p. 1 • Probability of x ≥ x0 but less than x1 is p. F(x) • Probability of x ≤ x1 is 1. p x x0 x1
F: Example 2 • There are five possible values: x0 ,…, x4. • Below x0 probability is 0. • Probability of x ≤ x0is p0. 1 • Probability of x ≤ x1 is p0+p1. • Probability of x ≤ x2 is p0+p1 +p2. p0+p1+p2+p3 • Probability of x ≤ x3 is p0+p1+p2+p3. F(x) p0+p1+p2 • Probability of x ≤ x4 is 1. p0+p1 • p0 + p1+ p2+ p3+ p4 = 1 p0 x x2 x3 x4 x0 x1
Examples 3 & 4 • Continuous distributions • In both cases W is the interval [x0, x1] • where x0is non-negative… • … and x1 is finite • F is differentiable, so… • …density f is defined • Example 3 • rectangular distribution • f(x) = 1 / [ x1− x0 ] • Example 4 • Beta distribution • [x0, x1] = [0,1]
Example 3 – rectangular distribution • Suppose values are uniformly distributed between x0 and x1. • Below x0 probability is 0. f(x) x x0 x1
F: Example 3 (cont) • Values are uniformly distributed over the interval[x0,x1]. • Below x0 probability is 0. 1 • Probability of x ≥ x0 but less than x1 is [x x0] / [x1 x0] . • Probability of x ≤ x1 is 1. F(x) x x0 x1
Example 4: Beta distribution • Support is bounded (above and below) • The density function with parameters a=0.5, b=0.5 x 0 1
Beta distribution (cont) • Support is bounded in [0,1] • The distribution function with parameters a=0.5, b=0.5 1 0 0 1
Example 5 • Lognormal distribution • Continuous • Unbounded support • W is the interval [0, ∞) • F is differentiable, so… • …density f is defined
Example 5: Lognormal distribution • Support is unbounded above. • The density function with parameters m=1, s=0.5 • The mean x 0 1 2 3 4 5 6 7 8 9 10
x 0 1 2 3 4 5 6 7 8 9 10 Lognormal distribution function 1