IFPS and NDFD
540 likes | 912 Views
IFPS and NDFD. Matt Moreland Forecaster NWSFO HGX March 2003. Tonight’s agenda…. Intro to IFPS GFE (Graphical Forecast Editor) ISC (Intersite Coordination) Web Images and Graphics NDFD (National Digital Forecast Database) Text Products The Future of IFPS IFPS Demonstration. IFPS.

IFPS and NDFD
E N D
Presentation Transcript
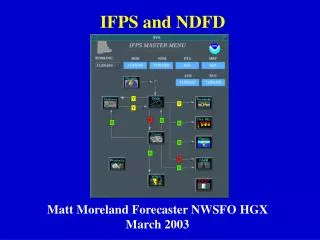
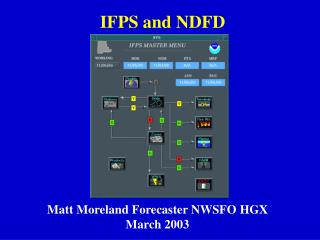
IFPS and NDFD Matt Moreland Forecaster NWSFO HGX March 2003
Tonight’s agenda… • Intro to IFPS • GFE (Graphical Forecast Editor) • ISC (Intersite Coordination) • Web Images and Graphics • NDFD (National Digital Forecast Database) • Text Products • The Future of IFPS • IFPS Demonstration
IFPS • What is IFPS? • IFPS – Interactive Forecast Preparation System • A new way of producing forecasts Drawing vs. Writing • A new way of distributing information Images vs. Text
IFPS Vision Statement (from NWS Southern Region) “Your Pin-Point NWS Forecasts for the 21st Century. Your way. Whenever you want it.”
Brief History • Collaborative development effort between: MDL (Meteorological Systems Laboratory) in Silver Spring, Maryland ~and~ FSL (Forecast Systems Laboratory) in Boulder, Colorado • First arrived on site in May 2001 • Very rapidly evolving and changing system: bears little resemblance to 2001 • Mostly written in Python programming language (invented at NASA)
Why Change to IFPS? • To produce a set of weather elements in a common digital database. • Digital database will become part of a national grid-based infrastructure that can be used by other government agencies and the private sector. • Availability of graphical images on the web for public use: - Already available on the HGX website!! - Resolution of 5 km will improve to 2.5 km by this summer - Images mostly available in 3-hour increments - Marine and Fire Weather images to be added soon
More Reasons To Change • Maximizes human contribution to forecast process • Provides greater forecast detail in time and space • Enables more effective communication with users • Increases usefulness of NWS forecasts to customers and partners
Advantages with IFPS • Faster and more frequent forecast updates • Greater detail in forecast products • More consistency in forecasts between NWS offices • Increased availability of information: forecast data can be downloaded for commercial use (more on this later)
GFE (Graphical Forecast Editor) • IFPS Forecaster Interface: used to edit grids and create final text products • Grids present for each weather element (T, Td, Wind, Sky, etc.) with varying time lengths for each grid • Forecaster can load model data into grids and tweak, or create new grids from scratch • Keeps a “rolling” database so current forecaster can view previous forecaster’s grids and maintain consistency between packages
GFE Features • Model data:can import AVN, ETA, GWW, MRF, and MOS guidance to as few or as many grids as desired • DFC (verification tool):compares your previous forecasts to actual climatological data by site • Contours:draw contours of weather parameters to create smoothed maps (preferred method) • Edit Areas:use pre-defined regions or save edit areas for personal use, then assign a value to this area • Map features:zoom in and out of map, or add desired geographic highlights (rivers, highways, cities) • Other features:sample points (specific data points), changeable color scale, and other configurable features
More on GFE • SmartTools and Procedures: help automate calculations needed on some grids examples: diurnal temperature curve, weather coverage based on PoP, and RH and Heat Index calculations • Small resolution: (currently 5 km) enables contouring of local effects into the grids: -- seabreeze front - urban heat island effect (metro Houston) - locally cool spots at night (like Conroe)
Example Procedure: Diurnal T Grids • Creates hourly T (temperature) grids on a diurnal curve for the specified time range based on forecaster’s MaxT/MinT grids • Diurnal curve created in T grids matches climatological station diurnal curve very well • Forecaster avoids having to painstakingly edit temperature data grid-by-grid
ISC (Intersite Coordination) • Enables forecasters to compare their grids to those of surrounding offices • Encourages more coordination between forecast offices and more consistent forecasts • “Smoothes” data in forecasters’ area to mesh better with data from surrounding WFOs • Chat/collaboration tools will be added for forecasters to coordinate with other offices in developing their forecast grids
Graphical Images vs. Text Products • More specific information will be available from graphical products. • New forecast images will complement ongoing forecast. • Wind Chill images in winter. • Heat Index images in summer. • Relative Humidity images year round.
Web Images produced by IFPS • Maximum and Minimum Temperatures – daily out to 48 hours (out to seven days on NDFD). • PoP forecasts – every 12 hours out to 48 hours (out to seven days on NDFD). • Temperature and Wind Barbs – every three hours out to 48 hours. • Relative Humidity and Wind Barbs – every three hours out to 48 hours. • Heat Index and Wind Chill – every three hours out to 48 hours (depending on time of year).
.png Images • Images will contain the following: • Interstates • County Warning Area • County outlines with several labeled city sample points with data
.png Images • Already posted on our website http://www.srh.noaa.gov/hgx • Under “Forecasts” menu on left-hand side select “Graphical” • Web template allows user to select a weather element of interest at a specific time • Images updated each time new grids are generated.
NDFD (National Digital Forecast Database)
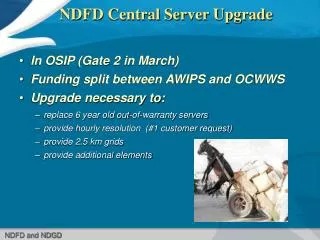
Facts About NDFD • Purpose: to provide a “seamless” digital forecast mosaic between NWS offices • Each forecast parameter will available out to 7 days for viewing on the NDFD website • Offices’ digital data will be available in compressed (tarred) packets for download by private vendors or the media in GRIB, Version 2 format • Limited availability of products now (doesn’t include HGX for downloads yet) • Target date for availability of nationwide data: Late 2003 or early 2004
The NDFD will contain… • Weather, water, and climate forecasts from the WFOs, RFCs, and NCEP • Elements that support generation of current WFO products • Digital watch, warning, and advisory information • Elements that support generation of national products per NDFD Product Development Process • Elements that would attract the private development of graphics and decision tools • The official NWS forecast for each element
NDFD Update Times • Products from individual NWS offices updated every 30 minutes • National (NCEP) products updated once an hour • NDFD transmitted hourly to NCDC (National Climatic Data Center) • Data Resolution: - every 3 hours through day 3 - every 12 hours days 4 through 7
Benefits Of NDFD • Better forecast collaboration between NWS offices • Implementation of GIS systems with the NDFD which leads to… • Weather information along a path • Text generation in more than one language • Forecasts for vehicles and GPS devices • Controls for smart appliances (heating, cooling, irrigation) • Graphics downloadable for mass media
Changes to NWS Text Products • Text forecasts are created with a series of text formatters run through the GFE XNOW GUI • Forecaster selects the product they want to run, changes the county groupings, and runs formatter • Information comes directly from the gridded forecast database, with minimal hand-editing necessary for the product afterwards • Frees up forecaster to spend less time typing out forecasts and more time on other duties
New format for FWF • Uses grids to compute transport wind, mixing height and hours of sunshine (and all other elements) • Red Flag Advisories listed • 20 foot wind (12 hr. avg) • Mixing height given in both feet and meters • Transport wind in knots and m/s • 24 hour trends for RH and temperature • Images will eventually be posted on website
7-day Coded-Cities Forecast • Data taken directly from forecast grids through Day 7 • First Line: day 1& 2 sky cover, MinT/MaxT through 60 hours, forecaster ID number, first 3 period PoPs • Second Line: sky cover days 3-7, MinT/MaxT from 6th period through Day 7, PoPs from 4th period out through 7 days (10 PoP periods altogether) • Forecaster ID number may be replaced by generic “Office ID” number for HGX by June 2003
New Text Products (“official” products by late Summer 2003) • Area Forecast Matrix (AFM) FOUS54 tabular forecast for county groups • Point Forecast Matrix (PFM) FOUS56 similar to AFM except a “point” forecast: College Station, Houston Intercontinental, Galveston • Service Area Forecast (SAF) areal forecast designed especially for Weather Radio
Area Forecast Matrix (AFM) • AFM Header including counties, county codes and issuance time. • Valid forecast time (in UTC and local time) • MN/MX: Max/Min temperatures • TEMP/DWPT: values in degrees Fahrenheit • RH: relative humidity values as a percent • WIND DIR/SPD: wind direction and speed • CLOUDS: CL (clear), SC (scattered), PC (partly cloudy), BK (broken), and OV (overcast) • POP 12HR: rain chance for that 12 hr period • QPF: amount of rainfall expected for a 12 hr period (as a range) • RAIN SHWRS/TSTMS: precip coverage – IS (isolated), SC (scattered). S (slight chance) C (chance), L (likely), D (definite or widespread) • OBVIS: any fog or other visibility obstructions • In the later periods… PWIND DIR: prevailing wind direction WIND CHAR: LT (light), BZ (breezy), WD (windy)
Service Area Forecast (SAF) • Zone forecast prepared for NOAA Weather Radio. • Can play multiple zones on NWR. • Process is automated.
ORD/IOC (more acronyms) ORD: Operational Readiness Demonstration (June/July 2003) NWS demonstrates nationwide IFPS readiness to Congress IOC: Initial Operating Capability: IFPS becomes “Official” (Sept. 2003) - Images posted to the web (all NWS offices) - Data sent to the NDFD (all NWS offices) - Ten baseline products issued through IFPS (all NWS offices): 1. Zone Forecast Product (ZFP) 2. Coded Cities Forecast (CCF) 3. Fire Weather Forecast (FWF) 4. Miscellaneous Fire Weather Prediction (FWM) 5. Coastal Waters Forecast (CWF) 6. Marine Verification Coded Forecast (MVF) 7. Near Shore Forecast (NSH) 8. Great Lakes Open Lake Forecast (GLF) 9. Service Area Forecast (SAF) (for CRS) 10. Tabular State Forecast (SFT)
IFPS – Practical Applications • New products can be created quickly by using various weather fields created in IFPS Practical applications: • Relative humidity and wind forecasts for firefighters fighting a grass or chemical fire. • Hourly heat indices for athletic teams with outdoor practices. • Cloud forecasts for photographers • Precipitation forecasts by the hour for construction crews to determine work stoppages • Wind and wave height forecasts for mariners plotting a specific trek
Upcoming Website Image Changes • New web image template set up this summer (haven’t seen it yet!!) • Weather and QPF Images: posted by June 2003 Weather images will show coverage and intensity of sensible weather parameters such as fog or the areal coverage of precipitation • Marine Images: wave height and offshore winds (Summer 2004 – probably sooner) • Fire Weather Images: mixing height, transport winds, daily hours of sunshine (Summer 2004)
IFPS in the future… • GIS System: will enable user to click on any point on a map on the website and get a specific 7-day forecast for that point, based on the IFPS database • Weather hazards graphics: probabilistic forecasts for severe weather and advisories displayed as graphics
GIS System – In use at NWS Kansas City:User selects elements they want in forecast, and a pin-point location by mouse click or lat/lon
Result: A 7-day forecast for a pin-point location straight from IFPS, not the ZFP
Tabular Forecast (from NWS Kansas City): hourly pin-point forecast for specified elements for 120 hour period
Site Meteogram (from NWS Kansas City): graphical representation of forecast for a pin-point location