Download
1 / 23
230 likes | 423 Views
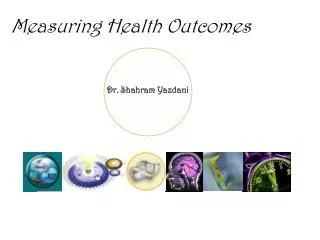
Health Outcomes due to Alcohol. 14 July 2005 Kanitta Bundhamcharoen MOPH. Acknowledgement. Ratchata Tangsiripat IHPP Thaksapon Thamarangsi IHPP and the Thai Working Group on burden attributable to risk factor Theo Vos Majid Ezzati. Outline. What are the effects of alcohol on health?

E N D
Health Outcomes due to Alcohol 14 July 2005 Kanitta Bundhamcharoen MOPH
Acknowledgement • Ratchata Tangsiripat IHPP • Thaksapon Thamarangsi IHPP • and the Thai Working Group on burden attributable to risk factor • Theo Vos • Majid Ezzati
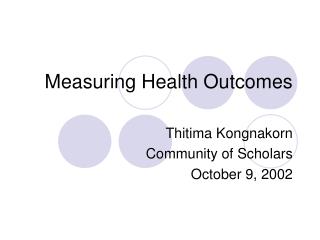
Outline • What are the effects of alcohol on health? • How do we measure the health loss? • How many healthy life years were lost due to alcohol?
Consumption, Mediators & Effects Pattern volume Intoxication Toxic effect Dependence Chronic disease Accidents/ injuries (Acute disease) Acute social problems Chronic social problems Ref: Babor et al. (2003)
Basic CRA framework and goals • Risk factor levels • current distribution • counterfactual • distribution(s) • Risk factor-disease relationships • risk accumulation • risk reversal Disease burden Attributable burden Avoidable burden
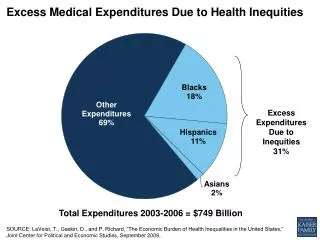
Burden of Disease • Burden of disease analysis provides a standardized framework for integrating all available information on mortality,causes of death,individual health status, and condition-specific epidemiology to provide an overview of the thelevels and causes of population health
Disability-Adjusted Life Years (DALYs) • One DALY is one lost year of ‘healthy’ life • DALY = YLL + YLD • DALY (Disability-Adjusted Life Years) = YLL (Years Lost Due to Premature Death)+YLD (Years Lived With Disability) • YLL = Dx * Ex(use standard life table (West level 26)) • YLD = Incidence * DW * Duration
DALYs = YLDs + YLLs Death/Life expectancy 80 yr Years lost due to premature death(YLLs) death Years lived with disability (YLDs) ill 0 yr birth person
Basic CRA framework and goals • Risk factor levels • current distribution • counterfactual • distribution(s) • Risk factor-disease relationships • risk accumulation • risk reversal Disease burden Attributable burden Avoidable burden
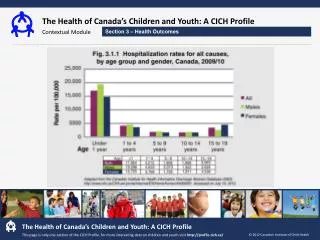
Burden of Disease and injuriesThailand, 1999 MALE FEMALE Rank Disease category DALYs loss Disease category DALYs loss % % 1 HIV/AIDS 960,087 17 HIV/AIDS 372,947 9 2 Traffic accidents 510,907 9 Stroke 280,673 7 3 Stroke 267,567 5 Diabetes 267,158 7 4 Liver cancer 248,083 4 Depression 145,336 4 5 Diabetes 168,372 3 Liver cancer 118,384 3 6 Ischaemic heart disease 164,094 3 Osteoarthritis 117,994 3 7 COPD (emphysema) 156,861 3 Traffic accidents 114,963 3 8 Homicide and violence 156,371 3 Anaemia 112,990 3 9 Suicides 147,988 3 Ischaemic heart dis 109,592 3 10 Drug dependence/ Harmful use 137,703 2 Cataracts 96,091 2 Source: Thai Working Group on BOD, 2002
Burden of Disease and injuriesThailand, 1999 MALE FEMALE Rank Disease category DALYs loss Disease category DALYs loss % % 11 Alcohol 130,654 2 COPD (emphysema) 93,387 2 dependence/harmful use 12 Cirrhosis 117,527 2 Deafness 87,612 2 13 Lung cancer 106,120 2 Lower respiratory tract 84,819 2 infections 14 Drownings 98,464 2 Low birth weight 83,879 2 15 Depression 95,530 2 Dementia 70,191 2 16 Osteoarthritis 93,749 2 Anxiety disorders 66,835 2 17 Tuberculosis 93,695 2 Schizophrenia 60,800 2 18 Deafness 93,497 2 Tuberculosis 60,643 2 19 Low birth weight 91,934 2 Birth trauma & asphyxia 57,488 1 20 Anaemia 87,610 2 Nephritis & nephrosis 55,258 1 Source: Thai Working Group on BOD, 2002
Risk Burden Source: Thai Working Group, MOPH, 2003
15 . 00 % Tota l 10 . 00 % DALY s 5 . 00 % % 0 . 00 % 0 - 4 0 - 4 15 - 29 30 - 44 45 - 59 60 - 69 70 - 79 80 + 0 - 4 5 - 14 15 - 29 30 - 44 45 - 59 60 - 69 70 - 79 80 + age group ( yrs ) unsafe sex water and sanitation Tobacco Physical inactivity malnutrition_international standard malnutrition_thai standard illicit drug use Non - Helmet No safety belts inadequate intake of fruit and vegetable cholesterol BMI Blood p ressure alcohol air pollution Risk burden by age group
6 % 5 % 14 % Stroke 6 % Cirrhosis 12 % Alcohol Burden attributable to alcohol: M Homicide and violence Suicides ca liver Traffic accidents 22 % Dependence 25%
Burden attributable to alcohol: F CA Liver Cirrhosis 7% Alcohol dependence 44%
Alcohol Consumption • Prevalence – Inter Asia (2000) Data • Average volume drinking category II: • females 20 – <40 g pure alcohol daily • males 40 – <60 g pure alcohol daily • Average volume drinking category III: • females 40+ g pure alcohol daily • males 60+ g pure alcohol daily
Relative Risk Ref: Ezzati et al (2004)
Relative Risk Ref: Ezzati et al (2004)
Injuries • Fraction of alcohol related injuries from Injury surveillance data