Download
1 / 50
500 likes | 769 Views
The E p,i – E iso correlation: cosmological use and reliability. Lorenzo Amati Italian National Institute for Astrophysics (INAF – IASF Bologna). Why look for more cosmological probes ?. different distribution in redshift -> different sensibility to different cosmological parameters.

E N D
The Ep,i – Eiso correlation: cosmological use and reliability Lorenzo Amati Italian National Institute for Astrophysics (INAF – IASF Bologna)
Why look for more cosmological probes ? • different distribution in redshift -> different sensibility to different cosmological parameters
Each cosmological probe is characterized by possible systematics • e.g SN Ia: • different explosion mechanism and progenitor systems ? May depend on z ? • light curve shape correction for the luminosity normalisation may depend on z • signatures of evolution in the colours • correction for dust extinction • anomalous luminosity-color relation • contaminations of the Hubble Diagram by no-standard SNe-Ia and/or bright SNe-Ibc (e.g. HNe)
If the “offset from the truth” is just 0.1 mag…. (slide by M. della Valle)
Guy et al. 2010 Astier et al. 2006 Recent results from SNLS (231 SNe Ia at 0.15 < z < 1.1, Guy et al. 2010) compared to those of Astier et al. 2006 (44 low redshift SNe along with the 71 SNe from the SNLS first year sample)
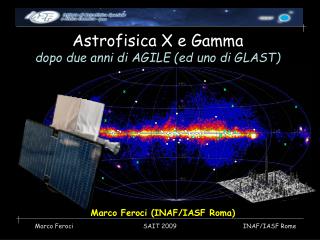
Why investigating Gamma-Ray Bursts ? • all GRBs with measured redshift (~220, including a few short GRBs) lie at cosmological distances(z = 0.033 – 8.2) (except for the peculiar GRB980425, z=0.0085) • isotropicluminosities and radiated energy are huge, can be detected up to very high z • no dust extinction problems; z distribution much beyond SN Iabut… GRBs are not standard candles (unfortunately) Jakobsson et al., 2010 Amati, 2009
jet angles, derived from break time of optical afterglow light curve by assuming standard afterglow model, are of the order of few degrees • the collimation-corrected radiated energy spans the range ~5x1049 – 5x1052 erg->more clustered but still not standard
The Ep,i – Eiso correlation • GRB nFn spectra typically show a peak at a characteristic photon energy Ep • measured spectrum + measured redshift -> intrinsic peak enery and radiated energy Ep,i = Epx (1 + z) Amati (2009) Ep
Amati et al. (A&A 2002): significant correlation between Ep,i and Eisofound based on a small sample of BeppoSAX GRBs with known redshift BeppoSAX GRBs
Ep,i – Eiso correlation for long GRBs with known redshift confirmed and extended by measurements of ALL other GRB detectors with spectral capabilities 120 long GRBs as of Oct. 2010 BeppoSAX GRBs
Ep,i ofSwift GRBsmeasuredby Konus-WIND, Suzaku/WAM, Fermi/GBM and BAT (only when Ep inside or close to 15-150 keV and values provided by the Swift/BAT team (GCNs or Sakamoto et al. 2008). Red points = Swift GRBs Slope ~ 0.5 s (logEp,i) ~ 0.2 Gaussian distribution of data scatter
definite evidence thatshort GRBs DO NOT follow the Ep.i – Eiso correlation: a tool to distinguish between short and long events and to get clues on their different nature (e.g., Amati 2006, Piranomonte et al. 2008, Ghirlanda et al. 2009)
3-parameters spectrum-energy correlations: prompting investigation of GRBs as cosmological probes • claims (2004): the Ep,i-Eiso correlation becomes tighter when adding a third observable: the jet opening angle derived from the afterglow break time tb,(qjet -> Eg = [1-cos(qjet)]*Eiso , (Ghirlanda et al. 2004) or directlytb(Liang & Zhang 2004)
Method (e.g., Ghirlanda et al, Firmani et al., Dai et al., Zhang et al.): Ep,i = Ep,obsx (1 + z) , tb,i = tb / /1 + z) Dl = Dl (z , H0 , WM , WL ,…) • fit the correlation and construct an Hubble diagram for each set of cosmological parameters -> derive c.l. contours based on chi-square
“Crisis” of 3-parameters spectrum-energy correlations • lack of jet breaks in several Swift X-ray afterglow light curves, in some cases, evidence of achromatic break • challenging evidences for Jet interpretation of break in afterglow light curves or due to present inadequate sampling of optical light curves w/r to X-ray ones and to lack of satisfactory modeling of jets ?
debate on Swift outliers to the Ep-Eg correlation (including both GRB with no break and a few GRB with achromatic break) • different conclusions based on light curve modeling and considering early or late break Campana et al. 2007 Ghirlanda et al. 2007
the Ep-Eg slope and dispersion depends on the assumptions on the circum-burst environment density profile (ISM or wind) ISM WIND Nava et al.. , A&A, 2005: ISM (left) and WIND (right)
Recent Fermi observationsconfirm the Ep,i – Eiso correlationand thatthe dispersion of the Ep – Eg correlation is likely significantly largerthan claimed in 2004-2005. Amati 2010 McBreen et al. 2010
growing number of outliers to the Ep-Eiso-tb correlation GRB071010B GRB 080916C Urata et al. 2009 Amati, Frontera, Guidorzi 2009
claims (2006): the Ep,i-Eiso correlation becomes tighter when adding a third observable: the “high signal time”T0.45(Firmani et al. 2006) • … but Rossi et al. (2008) and Schaefer et al. (2008) , based on BeppoSAX and Swift GRBs, showed thatthe dispersion of the Lp-Ep-T0.45 correlation is significantly higher than thought beforeand that the Ep,i-Lp,iso-T0.45 correlation my be equivalent to the Ep,i-Eiso correlation
Eiso<->Liso Ep,i – Eiso “Amati” 02 Eiso<->Lp,iso Ep,i – Liso 04 Ep,i – Lp,iso “Yonetoku”04 tb,opt + jet model tb,opt T0.45 = Ep,i – Eg “Ghirlanda” 04 Ep,i – Eiso-tb “Liang-Zhang” 05 Ep,i – Lp,iso-T0.45 “Firmani” 06 Using the simple Ep,i-Eiso correlation for cosmology • Ep,i – Eiso vs. other spectrum-energy correlations
Eiso is the GRB brightness indicator with less systematic uncertainties • Liso is affected by the often uncertain GRB duration (e.g., long tails of Swift GRBs); • Lp,iso is affected by the lack of or poor knowledge of spectral shape of the peak emission (the time average spectrum is often used) and by the subjective choice and inhomogeneity in z of the peak time scale • addition of a third observable introduces further uncertainties(difficulties in measuring t_break, chromatic breaks, model assumptions, subjective choice of the energy band in which compute T0.45, inhomogeneity on z of T0.45) andsubstantially reduces the number of GRB that can be used (e.g., #Ep,i – Eg~ ¼ #Ep,i – Eiso ) • recent evidences that dispersion of Ep,i-Lp,iso-T0.45 correlationis comparable to that of Ep,i - Eiso and evidences of outliers / higher dispersion of the Ep-Eg and Ep-Eiso-tb correlations
Amati et al. (2008): let’s make a step backward andfocus on the Ep,i – Eiso correlation Eiso<->Liso Ep,i – Eiso “Amati” 02 Eiso<->Lp,iso Ep,i – Liso 04 Ep,i – Lp,iso “Yonetoku”04 tb,opt + jet model tb,opt T0.45 = Ep,i – Eg “Ghirlanda” 04 Ep,i – Eiso-tb “Liang-Zhang” 05 Ep,i – Lp,iso-T0.45 “Firmani” 06
Amati et al. (2008): let’s make a step backward andfocus on the Ep,i – Eiso correlation Eiso<->Liso Ep,i – Eiso “Amati” 02 Eiso<->Lp,iso Ep,i – Liso 04 Ep,i – Lp,iso “Yonetoku”04 tb,opt + jet model tb,opt T0.45 = Ep,i – Eg “Ghirlanda” 04 Ep,i – Eiso-tb “Liang-Zhang” 05 Ep,i – Lp,iso-T0.45 “Firmani” 06
does the extrinsic scatter of the Ep,i-Eiso correlation vary with the cosmological parameters used to compute Eiso ? Dl = Dl (z , H0 , WM , WL ,…) 70 GRB Amati et al. 2008
a fraction of the extrinsic scatter of the Ep,i-Eiso correlation is indeed due to the cosmological parameters used to compute Eiso • Evidence, independent on SN Ia or other cosmological probes, that, if we are in a flat LCDM universe , WM is lower than 1 Simple PL fit Amati et al. 2008 Amati et al. 2008
By using a maximum likelihood method the extrinsic scatter can be parametrized and quantified (e.g., D’Agostini 2005) • WM can be constrained to 0.04-0.43 (68%) and 0.02-0.71 (90%) for a flat LCDM universe (WM = 1 excluded at 99.9% c.l.) • significant constraints on both WM and WL expected from sample enrichment 70 (real) GRBs 70 (real) + 150 (sim.) GRBs Amati et al. 2008
analysis of the most updated sample of 120 GRBs shows significant improvements w/r to the sample of 70 GRBs of Amati et al. (2008) • this evidence supports the reliability and perspectives of the use of the Ep,i – Eiso correlation for the estimate of cosmological parameters 114 GRBs 120 GRBs 70 GRBs
Calibrating the Ep,i – Eiso correlation with SN Ia • several authors (e.g., Kodama et al., 2008; Liang et al., 2008, Li et al. 2008, Tsutsui et al. 2009, Capozziello & Izzo 2010) calibrated the correlation at z < 1.7 by using the luminosity distance – redshift relation derived from SN Ia • The aim is to extend the SN Ia Hubble diagram up to redshift where the luminosity distance is more sensitive to dark energy properties and evolution • but with this method GRB are no more an independent cosmological probe
But… is the Ep,i – Eiso correlation “real” ? • different GRB detectors are characterized by different detection and spectroscopy sensitivity as a function of GRB intensity and spectrum • this may introduce relevant selection effects / biases in the observed Ep,i – Eiso and other correlations Band 2008 Ghirlanda et al. 2008
selection effects in the process leading to the redshift estimate are also likely to play a relevant role (e.g., Coward 2008) • Swift: reduction of selection effects in redshift -> Swift GRBs expected to provide a robust test of the Ep,i – Eiso correlation
claims that a high fraction of BATSE events(without z)are inconsistentwith the correlation (e.g. Nakar & Piran 2004, Band & Preece 2005, Kaneko et al. 2006, Goldstein et al. 2010) • but… is it plausible that we are measuring the redshift only for the very small fraction (10-15%) of GRBs that follow the Ep,i – Eiso correlation ?This would imply unreliably huge selection effects in the sample of GRBs with known redshift • in addition: Ghirlanda et al. (2005), Bosnjak et al. (2005), Nava et al. (2008), Ghirlanda et al. (2009) showed thatmostBATSE GRBs with unknown redshiftare potentially consistentwith thecorrelation • Substantially different conclusions, but… data are data, it cannot be a matter of opinions ! • tests have to take into account correctly the extrinsic scatter of the Ep,i – Eiso correlation
? OK
method: unknown redshift -> convert the Ep,i – Eiso correlation into an Ep,obs – Fluence correlation • the fit of the updated Ep,i – Eiso GRB sample with the maximum –likelihood method accounting for extrinsic variance provides a=0.53, k= 102, s = 0.19 • for these values f(z) maximizes for z between 3 and 5 3 s 2 s
a simple exercise: consider BATSE fluences and spectra from Kaneko et al. 2006 (350 bright GRBs) • Ep,i-Eiso correlation re-fitted by computing Eiso from 25*(1+z) to 2000*(1+z) gives K ~120, m ~0.53 ,s(logEp,i) ~ 0.2,Kmax,2s~ 250 2 s 3 s • only a very small fraction of GRBs (and with large uncertainties on Ep) are below the 2 s limit !
Amati, Dichiara et al. (2010, in progress): consider fluences and spectra from the Goldstein et al. (2010) BATSE complete spectral catalog (on line data) • considered long (777) and short (89) GRBs with fit with the Band-law and uncertainties on Ep and fluence < 40% SHORT LONG • most long GRBs are potentially consistent with the Ep.i – Eiso correlation, most short GRBs are not
ALL long GRBs with 20% uncertainty on Ep and fluence (525) are potentially consistent with the correlation LONG, 20% unc. LONG, 40% unc.
ALL long GRBs with 20% uncertainty on Ep and fluence (525) are potentially consistent with the correlation LONG, 20% unc. LONG, 40% unc.
in addition to the large uncertainties on Ep and fluences, biases in the estimates of Ep and fluence of weak hard events have also to be taken into account: • fits with cut-off power-law (COMP) tend to overestimate Ep because of the too steep slope above Ep BATSE, sample of Goldstein et al. 2010 BeppoSAX/GRBM (Guidorzi et al. 2010)
measure only the harder portion of the event: overestimate of Ep and underestimate of the fluence
Butler et al. based on analisys Swift/BAT spectra with a Bayesian method assuming BATSE Ep distribution: 50% of Swift GRB are inconsistent with the pre-Swift Ep,i - Eiso correlation • BUT: comparison of Ep derived by them from BAT spectra using a Bayesian method and those MEASURED by Konus/Wind show that BAT cannot measure Ep > 200 keV (as expected, given its 15-150 keV passband) • MOREOVER: Ep values by Butler et al. NOT confirmed by official analysis by BAT team (Sakamoto et al. 2008) and joint analysis of BAT + KW (Sakamoto et al. 2009) of BAT + Suzaku/WAM (Krimm et al. 2009) spectra.
Ep,i of Swift GRBs measured by Konus-WIND, Suzaku/WAM, Fermi/GBM and BAT (only when Ep inside or close to 15-150 keV and values provided by the Swift/BAT team (GCNs or Sakamoto et al. 2008):Swift GRBs are consistent with the Ep,i – Eiso correlation Red points = Swift GRBs Slope ~ 0.5 s (logEp,i) ~ 0.2 Gaussian distribution of data scatter
Amati, Frontera & Guidorzi (2009): the normalization of the correlation varies only marginally using measures by individual instruments with different sensitivities and energy bands: -> no relevant selection effects Amati , Frontera & Guidorzi 2009
the Ep,i– Liso correlation holds also within a good fraction of GRBs (Liang et al.2004, Firmani et al. 2008, Frontera et al. 2009, Ghirlanda et al. 2009):robust evidence for a physical origin and clues to explanation Frontera et al. 2010 (in prep.) Liang et al., ApJ, 2004
Conclusions and perspectives • Given theirhuge radiated energies and redshift distribution extending from ~ 0.1 up to > 8, GRBs are potentially a very powerful cosmological probe, complementary to other probes (e.g., SN Ia, clusters, BAO) • TheEp,i – Eiso correlationis one of the most robust (no firm evidence of significant selection / instrumental effects) and intriguing properties of GRBs and a promising tool for cosmological parameters • Analysis in the last years (>2008) provide already evidence, independent on , e.g., SN Ia, that if we live in a flat LCDM universe,Wm is < 1 at >99.9% c.l.(c2minimizes at Wm ~ 0.25, consistent with “standard” cosmology) • the simulatenous operation of Swift, Fermi/GBM, Konus-WIND is allowing anincrease of the useful sample (z + Ep) at a rate of 15-20 GRB/year, providing an increasing accuracy in the estimate of cosmological parameters • future GRB experiments (e.g., SVOM) and more investigations (statistical tools, simulations, calibration)will improve the significance and reliability of the results
a fraction of the extrinsic scatter of the Ep,i-Eiso correlation is indeed due to the cosmological parameters used to compute Eiso • Evidence, independent on SN Ia or other cosmological probes, that, if we are in a flat LCDM universe , WM is lower than 1 Simple PL fit Amati et al. 2008 - 2010 Amati et al. 2008
final remark: X-ray redshift measurements are possible ! • a transient absorption edge at 3.8 keV was detected by BeppoSAX in the firs 13 s of the prompt emission of GRB 990705 (Amati et al. Science, 2000) • by interpreting this feature as a redhsifted neutral iron edge a redshift of 0.86+/-0.17 was estimated • the redshift was later confirmed by optical spectroscopy of the host galaxy (z = 0.842)