Download

1 / 43
440 likes | 748 Views
Management of Discharge Home Process of Preterm Infants Using the Gantt Chart. Department of Neonatology Soroka Medical Center Beer Sheva, Israel.

E N D
Management of Discharge Home Process of Preterm Infants Using the Gantt Chart Department of Neonatology Soroka Medical Center Beer Sheva, Israel
Parents in neonatal intensive care unit are in need of :- Full and clear information on their baby’s condition.- Support in coping with stress. - Overcome uncertainty.- Social support. - Sense of involvement. - Parent – child attachment development. In intensive care period
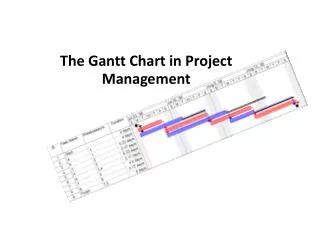
Discharge home of a preterm infant • The discharge home process is complex, involving multidisciplinary team at different stages of the process. • Needs an organized, well implemented discharge plan. • Might be managed as a project, using project management tools like the Gantt chart.
The Health Care System of The State of Israel • Population 7.000.000 • 5.300.000 of them are Jews. • Health expenditure = 8.4% of GNP. • National Health Insurance (since 1995). • Free antenatal and postnatal care to mothers and babies.
A general hospital of 1000 beds. • Serves the southern (desert) part of the country. (60% of the country’s area). • Provides services to a population of 500.000 (900.000 with referrals). • The main teaching hospital of the Ben-Gurion University Health Sciences Center. • In the process of accreditation by the JCI.
Department of Neonatologyat the Soroka Medical Center • A level III unit. • 24 beds NICU +34 beds SCU+Convalescence. • 12.500 births per year. • 55% of them are Bedouins. • 150 VLBW babies (under 1500 gm BW). • 2.000 admissions per year: • 500 to NICU + 1500 to SCU.
Department of Neonatologyand the Family Centered Care ideas • Associated in the WHO “Baby Friendly Hospital” initiative. • Parents are present in rounds. • Medical records are accessible to parents at bedside. Accredited by ISO9001.
The Bedouin population • A community in transition from nomadic to urban life style. • 27% of the population in the Negev area but 55% of newborn infants. • High fertility rate (average no. of children per mother=7) • High incidence of consanguinity. • High incidence of congenital anomalies. • High incidence of polygamy.
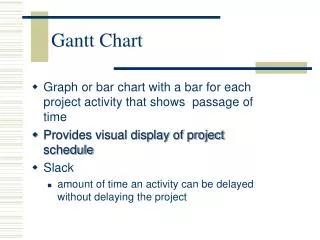
The Gantt Chart A Gantt chart is a popular type of bar chart that illustrates a project schedule. Gantt charts illustrate the start and finish dates of the terminal elements and summary elements of a project. Terminal elements and summary elements comprise the work breakdown structure of the project. Wikipedia Create a Gantt chart by Microsoft Excel: http://office.microsoft.com/en-us/excel/HA010346051033.aspx
Rate of weight gain(byBW groups) during preparations for discharge home
Gantt Chart for Discharge Plan • Presented to the family at discharge from ICN. • Presents stages of discharge plan along a time axis and related to GA and body weight. • Allows parents – staff cooperation. • Allows parents involvement which is vital for a successful discharge process.
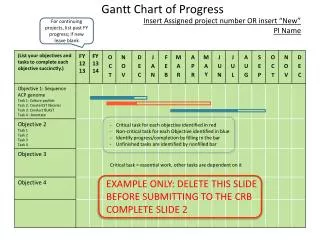
Using Gantt Chart allows for: • Clearly defined discharge criteria. • Parents control on the process. • Completion of goals predetermined to discharge date.
How much did we succeed in following the Gantt chart on time?
Data collection • Between December 2006- June 2007 • Gantt charts of preterm infants 34 weeks GA and 1500 gm. birth weight. • Hospitalization for at least 3 weeks after intensive care. • Total number of 39 preterm infants.
Difference (in days) between Actual vs Planned Discharge Dates(min/max and average) 32-3430.1-3228.1-3026.1-28 24-26
Summary • Parents involvement is vital for a successful discharge home process of preterm infants. • The Gantt chart helps inform parents of stages of discharge plan. • The Gantt charge allows: - Parents and staff monitoring of stages of the discharge process. - Parent empowerment in active care. - Parents partnership in the process. - Parents control on discharge activities
Summary • Many other treatment processes in the medical establishment which are well defined in their sequence of time and events can be looked upon as “Projects” and use a Gantt chart in their management.
Discharge home team Rina Marcu RN, MPH. Hagit Raz RN, MN. Shoshana Zilber RN, BN. Osnat Goshen RN, BN. Ehud Zmora MD, MHA