Download
1 / 63
630 likes | 759 Views
Greenland Ice Sheet. Slides courtesy of Jason E. Box Department of Geography Byrd Polar Research Center The Ohio State University Columbus, Ohio, USA. Research supported by. Orientation. 2.16 x 10 6 km 2 81% ice covered 3 x Texas 10% global land ice 7.4 m sea level equivalent

E N D
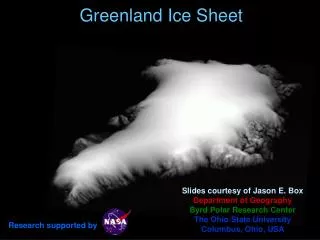
Greenland Ice Sheet Slides courtesy of Jason E. Box Department of Geography Byrd Polar Research Center The Ohio State University Columbus, Ohio, USA Research supported by
Orientation 2.16 x 10⁶ km2 81% ice covered 3 x Texas 10% global land ice 7.4 m sea level equivalent Max elevation of 3208 m @ Summit Greenland
http://en.wikipedia.org/wiki/File:Geography-of-greenland.svg
The surface slope over most of the Greenland Ice Sheet is barely 1o, but is much greater at the margins which is also characterized by numerous fiords and associated valley glaciers that drain the ice sheet. • Greenland has an estimated ice volume of is 2.93 × 10⁶ km3 and is the source of most of the icebergs found in the North Atlantic.
With adjustment for isostatic rebound, the water locked up in the Greenland Ice Sheet corresponds to an approximate global sea level equivalent of 7.2 m. • At present, 88% of the coterminous ice sheet lies in the accumulation zone (where annual mass gains exceed mass losses), with the other 12% lying in the ablation zone (where annual mass losses exceed more than loss gains).
Beginning in 1987, an automatic weather station (AWS) network was established in Greenland. Data from these stations provide a valuable addition to the few previous expedition measurements. • The high elevation, large extent and high albedo of the ice sheet are significant factors for local and regional surface air temperatures although latitude and distance inland are also involved.
For both the eastern and western slopes of the ice sheet, surface air temperatures (SATs) decrease by about 0.8oC per degree of latitude and by about 0.71oC per 100 m. • The ice sheet is characterized by pronounced low-level inversions, which are most strongly expressed during winter. • February tends to be the coldest month in Greenland. For instance, at Summit, summer maxima reach -8oC, whereas winter minima attain -53oC; however, there is strong daily variability in winter, which is associated with synoptic activity and katabatic winds.
Coastal Weather Stations Greenland Weather Station, 1945 Upernavik, 2005
Greenland Climate Network (GC-Net) Automatic Weather Stations (AWS) Steffen, K. and J.E. Box, 2001: Surface climatology of the Greenland ice sheet: Greenland Climate Network 1995-1999, J. Geophys. Res., 106(D24), 33951-33964.
Box, J.E., Survey of Greenland instrumental temperature records: 1873-2001, International Journal of Climatology, 22, 1829-1847, 2002.
Annual Surface Air Temperature Box, J.E., Survey of Greenland instrumental temperature records: 1873-2001, International Journal of Climatology, 22, 1829-1847, 2002.
January Surface Air Temperature Box, J.E., Survey of Greenland instrumental temperature records: 1873-2001, International Journal of Climatology, 22, 1829-1847, 2002.
A prominent feature of the Greenland climate, just as in Antarctica, is its katabatic wind regime; dynamically, katabatic winds in Greenland are the same as those found in Antarctica. • They relate to flows that are forced by radiational cooling of the lower atmosphere adjacent to the sloping terrain on the ice sheet. • Greenland’s katabatic winds, while not greatly influenced by topography, tend to flow with a pronounced component across the fall line because of the Coriolis force; however, winds near the coast are channeled by valleys and fiords.
Measurements at Swiss Camp during 1990-99 yield a maximum monthly mean wind speed of 9-11 m s-1 during November-January, and a minimum of 5 m s-1 in July, with the prevailing wind direction is from 120-130o, reflecting a katabatic regime. • Winds show strong directional constancy over most of the ice sheet.
Snow Transport1991-2000 Box, J.E., D. H. Bromwich, L-S Bai, 2004: Greenland ice sheet surface mass balance for 1991-2000: application of Polar MM5 mesoscale model and in-situ data, J. Geophys. Res., Vol. 109, No. D16, D16105, 10.1029/2003JD004451.
Direct observations of Greenland precipitation are particularly scant, as long records are limited to the coasts. • In recent years, data over the ice sheet have been acquired from automatic stations. • The main features of precipitation distribution over Greenland are very low accumulation (<100 mm yr-1) over the northern portions of the island with the highest values along the southeast coast where it exceeds 2000 mm yr-1.
Fairly high values are also found along the western coast related to orographic uplift and cyclone activity in Baffin Bay. • Accumulation basically represents the net effects of direct precipitation, its redistribution on the surface via wind scour and drifting, and mass losses due to melt and evaporation/ sublimation, and is typically assessed via snow pits or ice cores. • Based on coastal station observations of precipitation, adjusted for wind speed and accumulation data from recent ice cores, the annual precipitation averaged over the ice sheet is estimated to be 340 mm yr-1.
Precipitation1991-2000 Box, J.E., D. H. Bromwich, L-S Bai, 2004: Greenland ice sheet surface mass balance for 1991-2000: application of Polar MM5 mesoscale model and in-situ data, J. Geophys. Res., Vol. 109, No. D16, D16105, 10.1029/2003JD004451.
There are zones of maximum precipitation exceeding 2000 mm yr-1 in the southeast coastal area and 600 mm yr-1 in the northwest. Amounts in the north-central area are around 100 mm yr-1. • The southeastern maximum is strongly influenced by orographic uplift of southeasterly flow associated with traveling cyclones whereas the northwestern maximum is related to flow off northern Baffin Bay and uplift.
Sublimation refers to the exchange of water vapour between the surface and the overlying atmosphere during sub-freezing conditions (typical of Greenland) in which water molecules are transferred directly from the solid to the gas phase. • In the ablation area of the ice, estimates of annual sublimation are between 60 and 70 mm yr-1, whereas over the higher parts of the ice sheet, it is probably 20-30 mm during the summer months.
Sublimation over the ice sheet is highly variable in both space and time. • Maximum sublimation rates from the surface to the atmosphere tend to occur when temperatures are close to 0oC and winds are strong. • Deposition (vapour to solid) can occur under favourable synoptic conditions with a reversed humidity gradient or during nighttime due to radiative cooling.
An annual map of sublimation shows positive values over most of the ice sheet, and greatest in the warmer lower elevations during the summer season. • The highest elevations show a small vapour transfer from the atmosphere to the surface. • Overall, the estimated mass losses by sublimation account from possibly 12 to 23% of the annual precipitation, such that sublimation emerges as a fairly important term for the Greenland Ice Sheet mass budget.
Box, J. E. and K. Steffen, 2001 Sublimation on the Greenland ice sheet from automated weather station observationsJ. Geophys. Res., Vol. 106 , No. D24 , p. 33,965
Large parts of the Greenland ice sheet experience surface melt in summer, a process which can be assessed using satellite passive microwave brightness temperatures. • The melt areas shows a general association with latitude and elevation – melt occurs in the southern and coastal regions of the ice sheet, but not in the highest and hence coldest parts. • For the ice sheet as a whole, the area undergoing surface melt correlates strongly with surface air temperature anomalies.
The presence of melt inferred from passive microwave data does not imply that runoff is actually occurring. • In higher regions where melt is observed, it may only be occurring in a near-surface layer, whereas at lower elevations, meltwater that is formed will percolate to lower depths and re-freeze. • It is only near the coast that actual runoff is observed. In the southern part of the ice sheet, the area experiencing melt extends inland from the estimated equilibrium line (the line along which the net mass balance is zero).
12 July 2012 8 July 2012
Runoff1991-2000 Box, J.E., D. H. Bromwich, L-S Bai, 2004: Greenland ice sheet surface mass balance for 1991-2000: application of Polar MM5 mesoscale model and in-situ data, J. Geophys. Res., Vol. 109, No. D16, D16105, 10.1029/2003JD004451.
Zwally et al. 2002: Surface Melt-Induced Acceleration of Greenland Ice-Sheet Flow, Science
Zwally et al. 2002: Surface Melt-Induced Acceleration of Greenland Ice-Sheet Flow, Science
For Greenland, runoff is an important term but net ablation has only been measured directly at a few locations and therefore has to be calculated from models, which have considerable sensitivity to the surface elevation data set and the parameters of the melt and refreezing methods used. • Recent studies have suggested a loss of mass in the ablation zone and have brought to light the important role played by bottom melting below floating glaciers; neglect of this term led to erroneous results in earlier analyses.
Mass Balance • For Greenland, updated estimates based on repeat altimetry, and the incorporation of atmospheric and runoff modeling, indicate increased net mass loss, with most change toward the coasts.
Between 1993 to 1994 and 1998 to 1999, the ice sheet was losing 54 ± 14 gigatons per year (Gt/year) of ice, equivalent to a sea-level rise of 0.15 mm yr-1 (where 360 Gt of ice = 1 mm sea level). • The excess of meltwater runoff over surface accumulation was about 32 ± 5 Gt/year, leaving ice-flow acceleration responsible for loss of 22 Gt/year. • Summers were warmer from 1997 to 2003 than from 1993 to 1999, which likely explains the increased surface melt.
These results are broadly similar to those from a meso-scale atmospheric model used to simulate the surface mass balance of the Greenland Ice Sheet from 1991 to 2000. • Accounting for additional mass loss from iceberg discharge and basal melting (assumed constant) yielded an estimated net mass loss of 78 Gt/year.
Large interannual variability did not obscure significant simulated trends toward increased melting and snowfall consistent with reconstructed warming, especially in west Greenland. • GRACE provides monthly estimates of Earth's global gravity field at scales of a few hundred kilometers and larger. • Time variations in the gravity field can be used to determine changes in Earth's mass distribution.
GRACE has therefore been applied to examine mass balance variations in both the Greenland and Antarctic ice sheets. • Dramatic new evidence has emerged of the speed of climate change in the polar regions which scientists fear is causing huge volumes of ice to melt far faster than predicted.
Monthly ice mass changes and their best-fitting linear trends for WAIS (red) and EAIS (green) for April 2002 to August 2005. The GRACE data have been corrected for hydrology leakage and for PGR. (Source: Velicogna and Wahr, 2006).
Surface Mass Balance1988-2004 Box, J.E., D.H. Bromwich, B.A. Veenhuis, L-S Bai, J.C. Stroeve, J.C. Rogers, K. Steffen, T. Haran, S-H Wang, Greenland ice sheet surface mass balance variability (1988-2004) from calibrated Polar MM5 output, J. Climate, accepted Sept 27 2005.
Scientists have recorded a significant and unexpected increase in the number of "glacial earthquakes" caused by the sudden movement of Manhattan-sized blocks of ice in Greenland. The rise in the number of glacial earthquakes over the past four years lends further weight to the idea that Greenland's glaciers and its ice sheet are beginning to move and melt on a scale not seen for perhaps thousands of years. Glacial Earthquakes
The annual number of glacial earthquakes recorded in Greenland between 1993 and 2002 was between six and 15. In 2003 seismologists recorded 20 glacial earthquakes. In 2004 they monitored 24 and for the first 10 months of 2005 they recorded 32. • The latest seismic study found that in a single area of north-western Greenland scientists recorded just one quake between 1993 and 1999. But they monitored more than two dozen quakes between 2000 and 2005.
Some of Greenland's glaciers can move 10 metres in less than a minute, a jolt that is sufficient to generate moderate seismic waves. • As the glacial meltwater seeps down it lubricates the bases of the "outlet" glaciers of the Greenland ice sheet, causing them to slip down surrounding valleys towards the sea. • Of the 136 glacial quakes analysed by the scientists, more than a third occurred during July and August.