Download
1 / 31
310 likes | 332 Views
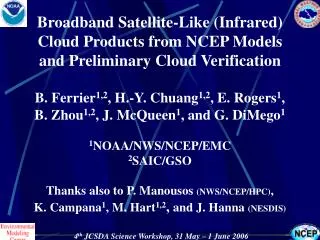
This study compares RUC model cloud analyses and forecasts with satellite-derived cloud properties to guide assimilation of satellite cloud parameters and provide a baseline for future model evaluations. The study includes recent satellite validation, statistical comparisons of cloud properties, and summaries of satellite data.

E N D
Comparison of RUC Cloud Analyses and Forecasts with Satellite-derived Cloud Properties Bill Smith, Patrick Minnis NASA LaRC Stan Benjamin, Steve Weygandt NOAA/ESRL/GSD/AMD
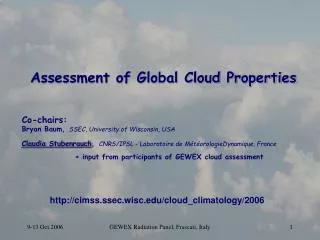
Outline Goal: Perform statistical comparison between RUC and LaRC satellite-derived cloud properties to help guide the assimilation of satellite cloud parameters and provide baseline for future model evaluations. • Recent satellite validation (GOES Cloud height, water path) • Statistical Comparisons (several months) • Cloud Amount • Cloud Height • Cloud Thickness • Cloud Water Path • Summary
Satellite Data • NASA LaRC Real-Time 8-km CONUS cloud products derived from GOES-E and GOES-W (Cloud top phase, height, water path) • CLOUDSAT cloud water path • NOAA NESDIS Operational Cloud top Height Product (CO2-slicing)
RUC Data Dataset 1 (4 months): • Feb 12 - Apr 27, 2007; May 10 - July 4, 2007 • Analyses, 1-hr, 3-hr and 6-hr forecasts valid at 18 UTC • Obtained to test Model analyses and forecasts with GOES Note: Jan 8, 2008 RUC crisis change implemented for improved cloud/vis assimilation. Dataset 2 (55 days): • March 17 - May 28, 2008 (18, 19, 20, 21, 22 UTC Analyses) • No Forecasts • Obtained for GOES and Cloudsat Comparisons over CONUS
RUC Cloud Assimilation • Use multiple data types to modify cloud, • hydrometeor, and moisture fields: • -- NESDISGOES cloud-top pressure/temp • (implemented in 2002 w/ RUC20) • -- Surface METAR (clouds, weather, visibility) • (2005 w/ RUC13) • Construct 3-d logical arrays (YES/NO/UNKNOWN) • for clouds and precipitation from all info • Clear/build moisture, cloud, precipitation fields • Safeguards for known problems (marine stratus, • convective clouds, snow, nocturnal inversion)
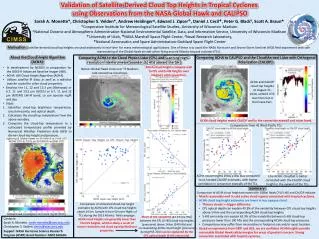
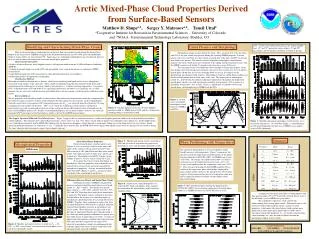
X - CO2 slicing LaRC LaRC and NESDIS Cloud Top Height Comparisons with ARM ARSCL data Smith et al. 2008 (GRL) 5-yr dataset Single-layer clouds Satellite-derived Cloud Top Height Bias Errors (km)
LWP (MODIS) Satellite Liquid Water Path Validation Dong et al., JGR, 2007 • Unbiased over wide range of LWP (up to 500 g/m2) • Excellent correlation • Instantaneous Uncertainty ~30% • Note mean value ~150 g/m2
Cloud Ice Water Path (From Waliser et al. 2008) LaRC CERES (analogous to LaRC GOES) compares well with CloudSat IWP
Instantaneous matched GOES-CloudSat Water Path1930 UTC, 1 March 2007 CloudSat Reflectivity
GOES Cloud Water Path Comparisons with Cloudsat Dec 2006 – May 2007 • Excellent agreement between GOES and Cloudsat monthly mean total water path for high thick clouds. • Thin ice cloud IWP also in good agreement • LWP from Cloudsat is unreliable Statistical Summary for All Months
Matching Procedures Spatial Matching:GOES 8-km pixel products averaged to RUC 20 km grid. Temporal Matching:1745 UTC GOES within 15 minutes of RUC analyses and forecasts with valid times at 18 UTC. RUC grid box either OVC or CLR. GOES is OVC, CLR or PC RUC Total Water Path:Computed from 5 species level mixing ratios (cloud water, cloud ice, rain water, snow, graupel). RUC Cloud Phase:Only analyzed in the top layer. Comparisons shown here are stratified by cloud phase (I.e. clouds with either liquid or ice water tops
Example Cloud Top Phase Comparison - May 8, 2008 (1800 UTC) GOES INFRARED GOES VISIBLE GOES CLOUD TOP PHASE RUC CLOUD TOP PHASE (0-hr fcst) Ice Liquid Mixed SLW Clear
RUC/GOES CLOUD FREQUENCY DIFFERENCES (%)FOR LAND and OCEAN RUC ANALYSIS minus GOES RUC ANALYSIS minus GOES 2008 dataset 2007 dataset Ocean Ocean Land Land All clouds Ice Liquid 3 22 -10 10 19 -4 All clouds Ice Liquid 3 23 -10 10 15 0 RUC has too much high-level ice cloud (land & ocean) and too little low-level liquid cloud (over land) relative to GOES.
RUC Cloud Frequencies with and without NESDIS Satellite Data Compared to LaRC GOES No NESDIS Data With NESDIS Data (Lat > 50˚ N) (Lat ≤ 50˚ N) GOES GOES RUC RUC All clouds Ice Liquid 79 68 5 77 33 29 All clouds Ice Liquid 54 38 10 44 16 17 Low-level liquid cloud frequency difference largest over Canada where no satellite data are used. Large ice cloud frequency differences in both regions.
All Relative Frequency (%) 0 25 50 100 200 300 500 750 1000 1500 2000 3000+ TWP (gm-2) RUC Analysis GOES Distribution of Ice Cloud Frequency for GOES and RUC (2008) Relative Frequency (%) of Total Water Path for Clouds with Ice Phase Tops • Other possible reasons for discrepancy: • Cloud phase differences (mixed phase regime) • Poor GOES phase ID (multilayer systems) 35% of the ice cloud difference is found in the lowest bin 2008 Test Dataset
RUC CLEAR/CLOUD FREQUENCIES FOR GOES 100% OVERCAST REGIONS RUC CLEAR % RUC CLOUD % 2007 2008
RUC CLEAR/CLOUD FREQUENCIES FOR GOES 100% CLEAR REGIONS RUC CLEAR % RUC ICE % RUC CLOUD % RUC LIQUID % 2007 2008
RUC CLOUD FREQUENCIES FOR GOES OVERCAST ICE CLOUD REGIONS RUC CLOUD FREQUENCY ICE CLOUDS CLEAR LIQUID CLOUDS MIXED PHASE 2007 2008
RUC CLOUD FREQUENCIES FOR GOES OVERCAST LIQUID CLOUD REGIONS RUC CLOUD FREQUENCY ICE CLOUDS CLEAR LIQUID CLOUDS MIXED PHASE 2007 2008
Water Path Comparison Nov 8, 2008 (1800 UTC) GOES WP RUC WP GOES Cloud Phase GOES minus RUC WP
Liquid Water Cloud Parameter Comparison Land Ocean • GOES LWP >> RUC LWP, 2008 RUC compares better • LaRC GOES cloud top heights and thicknesses exceed RUC values • Accounting for cloud thickness differences would yield better LWP agreement over Ocean but not Land.
Ice Cloud Parameter Comparison Land Ocean • GOES IWP >> RUC IWP • LaRC GOES and RUC cloud top heights agree for Analyses • RUC forecasted cloud top height exceeds GOES by over 0.5 km • GOES cloud thickness likely underestimated (poor Deep Convective estimates) • Land/Ocean differences generally consistent
Summary • The RUC is one of the more advanced NWP models worldwide that assimilates cloud observations. • Comparison of RUC cloud parameters with similar parameters derived from GOES indicate the RUC assimilation works reasonably well. • However, significant differences have been identified that exceed the satellite-derived uncertainties which implies that assimilation of LaRC GOES-derived cloud products could lead to improved cloud analyses and forecasts in the model. • Results from this study are being used to guide the assimilation of satellite-derived cloud parameters and also provide a baseline for future model evaluations.
Regional Liquid Water Path Comparison (g/m2) 2008 Poor agreement over the Atlantic but good over Pacific and Gulf of Mexico
Regional Ice Water Path Comparison (g/m2) 2008 RUC does track GOES regional differences.
Cloud Ice Water Path (From Waliser et al. 2008) CloudSat MODIS MYD06 CERES-MODIS ISCCP CERES-MODIS most similar to CloudSat values