Download
1 / 21
210 likes | 229 Views
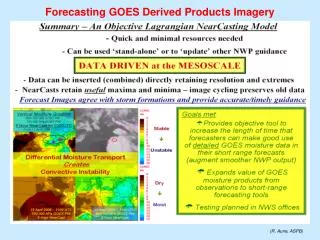
Analytical study validating cloud properties derived from GOES-8 satellite data over the Southeastern Pacific, focusing on methodology, required inputs, sample products, validation results, conclusions, and future work.

E N D
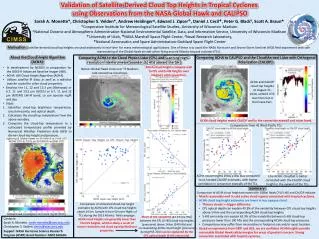
Validation of GOES-8 Derived Cloud Properties Over the Southeastern Pacific J. K. Ayers1, P. Minnis2, R. Wood3, P.W. Heck1, D. F. Young2, W. L. Smith, Jr.2, C. W. Fairall4, T. Uttal4 1 Analytical Services and Materials, Inc, Hampton, VA 2 NASA Langley Research Center, Atmospheric Sciences, Hampton, VA 3 Atmospheric Sciences, University of Washington, Seattle, WA 4 NOAA ETL, Boulder, CO
Outline • Introduction • Cloud Property Retrieval • VISST/SIST Methodology • Required Inputs • Sample Cloud Properties • Hourly • Pixel Level, Gridded • Monthly • Gridded • Validation • Tc, Zc, t, re, LWP • Conclusions • Future Work
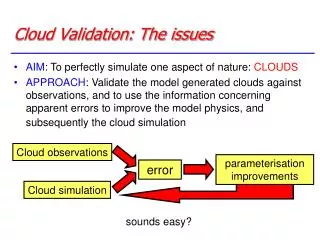
Introduction • Why do we need satellite cloud products? • Very important climatic region • ITCZ • Stratocumulus region • Southern hemispheric storm track • Region is vast and in-situ measurements are limited • Satellite cloud products are the only way to get near continuous coverage of the entire region • Why do we need validation? • Without validation satellite products are suspect • Provides means for correcting and proving algorithms
Methodology • Visible Infrared Solar-Infrared Split Window Technique (VISST) • Daytime • 0.65, 3.9, 10.8, 12.0 µm channels • Utilizes parameterization of theoretical radiance calculations for 7 water and 9 ice crystal size distributions • Retrieves cloud optical properties by matching calculations to observations • Solar-Infrared Infrared Split Window Technique (SIST) • Night • 3.9, 10.8, 12.0 µm channels • Minimum error, iterative regression method • Retrieves cloud optical properties by matching calculations to observations
Required Inputs • Soundings from model runs or in-situ measurements • Surface characterization from IGBP 10 minute map • Uses CERES cloud mask algorithm • Clear sky reflectances from CERES & GOES-based ocean model • Narrowband to Broadband flux conversion functions from GOES-ERBE • Satellite data (GOES-8, GOES-10) 4-km pixel resolution
Sample Products - Hourly Pixel Level (11/01/99 , 14:45 UTC) Cloud Mask Cloud Height Ice Water SLW No Ret Clear Liquid Water Path Effective Droplet Radius
Monthly Gridded Cloud Fractions (1°) April Jan July Oct
Validation • VISST/SIST • Analysis for a 1° box centered on the ship • Solar zenith angle restricted to 82° or less • Cloud limited to a single phase in most cases • Appropriate properties adjusted by cloud fraction • Fall 2000 • 20 minute average centered on satellite image time • Fall 2001 • 60 minute average centered on image time • 20 minute average centered on satellite image time (Cloud Height)
Comparison of Satellite and Ceilometer Cloud Fraction(Fall 2000 Cruise) Cmean = 64.3%, Vmean = 60.4%, StDev = 24%
Comparison of Radar and VISST Derived Cloud Heights ( Fall 2000 ) High Cloud Mean Radar = 13.0 km RMS = 0.99 %RMS = 7.7 Bias = 1.6 N=11 Low Cloud Mean Radar = 1.92 km RMS = 0.97 %RMS = 50.0 Bias = 0.14 N = 29
Cloud Height Comparison Mean Radar = 1.2 km RMS = 0.27 %RMS = 22.5 Bias = 0.17 N=54
Cloud Fraction Comparison Cmean = 92.6%, Vmean = 84.3%, StDev =12%
Cloud Temperature Comparison Mean Rad. = 281.8 RMS = 0.85 %RMS = 0.3 Bias = -0.2 N=56
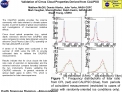
Optical Depth Comparison Mean MW+ST = 14.8 RMS = 7.9 %RMS = 54.2 Bias = -0.66 N=17
Liquid Water Path Comparison Mean MW= 85.3 RMS = 71.3 %RMS = 83.6 Bias = -51.7 N=29
Effective Droplet Radius Comparison Mean MW+ST = 10.7 RMS = 6.9 %RMS = 65.4 Bias = -6.3 N=17
Conclusions • Cloud amounts in good agreement, need to explore cases of poor agreement • Cloud heights are as good as we can expect, some issues with overlap • Diurnal cycles for all parameters show good agreement • Magnitude of re differences in question
Future Work • Explore cases of bad agreement for cloud amount • Compare nocturnal cloud amount and heights • Examine re differences more closely • Evaluate microwave LWP using different techniques and compare with SSMI and TMI (on TRMM) • Compare TOA albedos from VISST and surface with CERES instrument on TERRA • Compute average lapse rate for each cruise to determine if a change in cloud height determination method is needed • Continue producing products for the domain, implement improvements from comparisons