STEEP Data Management
STEEP Data Management. Ease, Reliability, Power. STEEP Data Management. Goal: Make it simple to implement RTI correctly Select Students who Need Intervention Select an appropriate intervention Using a validated standard protocol Monitor Progress System monitors data on rate of learning

STEEP Data Management
E N D
Presentation Transcript
STEEP Data Management Ease, Reliability, Power
STEEP Data Management • Goal: Make it simple to implement RTI correctly • Select Students who Need Intervention • Select an appropriate intervention • Using a validated standard protocol • Monitor Progress • System monitors data on rate of learning • Zero in quickly on students who don’t respond to intervention
Use any Screening Method • System will easily manage any method of screening including • DIBELS • STEEP • TPRI (Texas Primary Reading Inventory) • Any other method. • Use any standard • Completely customizable such that districts can evaluate student scores relative to any standard • View students with respect to DIBELS, state, school or district standards or benchmarks (Unique to STEEP).
Manage • Early literacy Benchmark data from DIBELS • CBM benchmark data for any type of assessment using any benchmark • Middle and high school benchmark data • Tier 2 and Tier 3 intervention data • Progress monitoring data for IEP goals in special education.
New to Data Management? • What can you do with a data management system? • Basic users (about 90% of all users) • Enter benchmark and progress monitoring scores • Review reports for benchmark and progress monitoring • Advanced users • Examine student level and rate of performance aggregated by school, teacher, NCLB subgroups, etc. • “Drill down” into the data • STEEP is simple for basic users with the power needed for advanced users.
Using the Data System • Steps • Enter students • Enter screening scores • Select students for intervention • Monitor intervention use and student outcomes • Evaluate success Working with the System is Easy
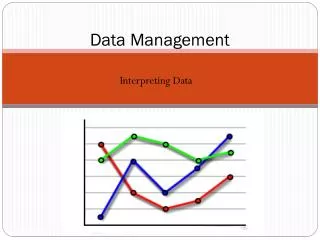
Quickly know • Which students need intervention (those in red) • Which students are low because of motivation • Whether there are Tier 1 issues
System manages any Data. Here CBM reading scores are viewed using TEKS standards (Texas)
DIBELS Initial Sound Fluency Determine Quickly who is in “Red” on DIBELS Then let system recommend an intervention.
Teachers Receive Written Reports to Guide Intervention Planning • Sample Report Segment: • “LANASHA KOHN appears to have a WON'T DO Problem. This means that academic performance increased markedly when an incentive was offered. Typically this means that the child can perform this skill but does not always perform in line with their ability. “
Intervention Selection • Select students needing intervention: • After screening, the data system will automatically select and list those students who need intervention. • Select Intervention. (Unique to STEEP) • The system will then automatically select the type of reading intervention a student needs • Using STEEP standard protocol. • Can be used with DIBELS and others systems
Which Students Need Help? • User or System Can Select Students Needing Intervention
System will list Students Needing Assistance User Can Then Select Students to Proceed with Intervention Planning and Setup
Systems Determines Specific Intervention Needed • System Coaches users to: • Gather additional assessment information if needed • System evaluates screening data and any additional assessment data and specifies intervention to match student need. Unique to STEEP
During Intervention • Progress Monitoring Data is Entered and Continuously Monitored by Data System • Intervention Fidelity is Monitored • Intervention Data is Continuously Monitored by professionals and entered into system • iSTEEP has partnered with third party intervention companies and will soon make available automatic real time monitoring of intervention usage for specific web based interventions.
Automatic Setup of Progress Monitoring • Progress goals can be set based upon research based standards, local standards or any other standard. • Aimline is automatically drawn. • NO COMPUTATIONS FOR USER.
Students Can “Help” Enter Their Score to Improve Motivation • This graph is animated and child friendly
Advanced Users • Power Users will Appreciate the Ability to • Aggregate data on any variable • Principals can look across their school • Superintends can perform comparisons across schools • District Norming is Easy
Progress by Teacher • Which teachers in a school show the most progress. • Which teachers need support. • What strategies are working for the teacher on the right?
This Graph Shows the average increase in WRC per week. (The emerging metric for RTI) Drill down—for low performing classes, which specific students are not making progress?
Assessment by Race This graph suggests possible Tier 1 Problems for Hispanic Students
Aggregation by All NCLB Subgroups for Level and Slope Rate of Student Progress Level of Student Performance Use for Goal Setting
Average Progress in Grade 2 The mean (in Red) and other statistics useful for norming by grade within schools or across multiple schools.
Superintendents View Across 8 Schools Rate of Growth for 8 Schools Score Levels at start of year for 8 Schools
STEEP: Validated and Proven Practices Screen Prescribe Intervention Monitor Progress
Contact: iSTEEP, LLC Miyo Chun, PhD miyo@isteep.com Joe Witt, PhD joe@isteep.com