Download
1 / 25
260 likes | 420 Views
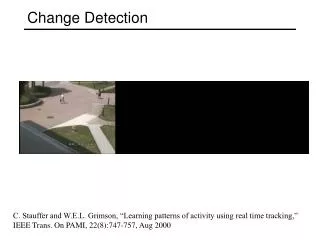
Visual Interpretation for Forest Change Detection in Fiji. Vilisi Tokalauvere SOPAC Pacific GIS&RS Conference November 2011 Lotus Building, Suva. Purpose of Forest Mapping. Direct comparison of digital forest layers 1991 and 2001 did not work

E N D
Visual Interpretation for Forest Change Detection in Fiji Vilisi Tokalauvere SOPAC Pacific GIS&RS Conference November 2011 Lotus Building, Suva
Purpose of Forest Mapping • Direct comparison of digital forest layers 1991 and 2001 did not work • Layer 1991 and layer 2001 had to be adjusted through visual image interpretation • Forest layers 1991 and 2001 had to be geometrically corrected
Why visual interpretation? • Pacific Island Country conditions are different! • Transparent work • Local knowledge added • Difficult atmospheric conditions
Forest Cover Mapping 1991 • Supervised maximum likelihood classification with DTM involvement • Conducted by a company in northern Germany
Forest FunctionMap 1992 Raster data GIS application
Forest Inventory 2006 • Conducted with image data recorded 2001/2002 • Condition maximum likelihood classification • Solution: Unsupervised classification with maximum visual interaction • Mask building • Reducing 3 forest densities (1991) to 2
ERDAS Mangrove Mask Mangrove mask Vanua Levu
Haze Different thresholds
Visual Interpretation Pine Plantation Mangrove Forest
Decisions During Digitising Digitising from Forest Layer 1991 Yes Clouds Y/N ? No Digitising from Plantation Layer 1991 Plantation area Y/N ? Yes No Digitising from both image backdrops
MapInfo to ERDAS • Forest, Mangrove polygons exported (DXF) to ERDAS. • Add Projection. • Convert to raster. • Add to forest cover layer.
Reducing to Mappable Area Size Cluster No. 2384 1.2 ha Clump All clusters < 1 hectare are joined with the next biggest neighbour class Eliminate
Next.. • Fiji Department of Agriculture – agriculture, bare land, pasture land