Download
1 / 45
450 likes | 484 Views
Learn about the process of forest change detection using MODIS data and how to prioritize sketch mapping for forest disturbances. This presentation by Bonnie Ruefenacht provides guidance on creating spatial summaries of forest disturbance and analyzing vegetation anomalies.

E N D
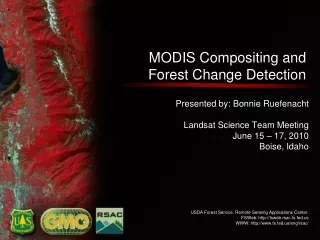
MODIS Compositing and Forest Change Detection Presented by: Bonnie Ruefenacht Landsat Science Team Meeting June 15 – 17, 2010 Boise, Idaho USDA Forest Service, Remote Sensing Applications Center, FSWeb: http://fsweb.rsac.fs.fed.us WWW: http://www.fs.fed.us/eng/rsac/
Background • Need information to prioritize sketch mapping aerial detection survey flights • 2-4 week response time • Guidance on where to go vs. where not to go (omission and commission error important) • Standardized and repeatable method for producing spatial summaries of forest disturbance USDA Forest Service, Remote Sensing Applications Center, http://fsweb.rsac.fs.fed.us
Insect damage characteristics Mountain pine beetle Gypsy moth defoliation Balsam bark beetle Larch casebearer USDA Forest Service, Remote Sensing Applications Center, http://fsweb.rsac.fs.fed.us
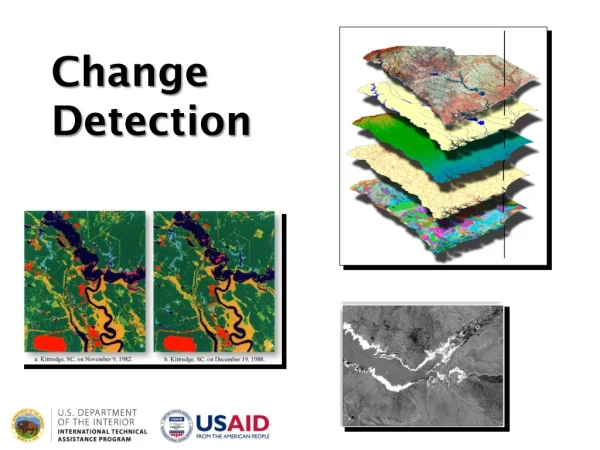
Basic change detection steps 1) Create vegetation baseline (5 years of MODIS data) 2) Process current-year data (to match baseline) 3) Derive analysis classes (both static and dynamic) - control for effects of forest cover differences and BRDF - FIA forest group classes (static) - scattering angle classes (dynamic) 4) Class-wise statistical analysis (resistant z-scores; RZ) 5) Calculate anomaly scores (ΔRZ) between current-year and baseline data 6) Derive vegetation indices based on anomaly scores USDA Forest Service, Remote Sensing Applications Center, http://fsweb.rsac.fs.fed.us
Basic change detection steps 1) Create vegetation baseline (5 years of MODIS data) 2) Process current-year data (to match baseline) 3) Derive analysis classes (both static and dynamic) - control for effects of forest cover differences and BRDF - FIA forest group classes (static) - scattering angle classes (dynamic) 4) Class-wise statistical analysis (resistant z-scores; RZ) 5) Calculate anomaly scores (ΔRZ) between current-year and baseline data 6) Derive vegetation indices based on anomaly scores USDA Forest Service, Remote Sensing Applications Center, http://fsweb.rsac.fs.fed.us
Why MODIS? • High Temporal Grain (daily) - permits frequent observations to capture disturbances with very finite temporal windows • High Spectral Grain (blue, green, red, NIR, and MIR wavelengths) - disturbances in forest health discernable using spectral indices (NDVI, NDMI, NDFI) • RSAC’s MODIS ground station makes for easy access to MODIS data. • Coarse resolution makes the MODIS data more manageable and more area is covered with a single path. USDA Forest Service, Remote Sensing Applications Center, http://fsweb.rsac.fs.fed.us
Current MODIS Data – 16-day Composites Compositing periods overlap - Data delivered every 8 days 15 Apr 30 Apr 23 Apr 8 May 1 May 16 May 9 May 24 May USDA Forest Service, Remote Sensing Applications Center, http://fsweb.rsac.fs.fed.us
Compositing Process • Imports MODIS AQUA and TERRA L2 data from HDF to IMG format. • Reprojects to CONUS Albers NAD 83. • Throws out pixels with viewing angles >= 50 degrees. • Computes NDVI. • Compares NDVI values for a pixel over the time period. • Selects the pixel with the highest NDVI value. USDA Forest Service, Remote Sensing Applications Center, http://fsweb.rsac.fs.fed.us
Example If an 8-day composite was being created NDVI Values 0.539 0.574 0.540 0.480 0.552 0.102 0.034 0.559 Low NDVI values indicates clouds. Use this day’s data for the composite. USDA Forest Service, Remote Sensing Applications Center, http://fsweb.rsac.fs.fed.us
Compositing Process • Imports MODIS AQUA and TERRA L2 data from HDF to IMG format. • Reprojects to CONUS Albers NAD 83. • Throws out pixels with viewing angles >= 50 degrees. • Computes NDVI. • Compares NDVI values for a pixel over the time period. • Selects the pixel with the highest NDVI value. However . . . . USDA Forest Service, Remote Sensing Applications Center, http://fsweb.rsac.fs.fed.us
Cloud Good pixel in Bands 1 & 2, but cloud pixel in the other bands resulting in halo effects around clouded areas in the composites. 500 m Problem: Different Resolutions MODIS Bands 1 & 2, which are used to calculate NDVI, are 250 m resolution. Bands 3 – 7, which are included in the composites are 500 m resolution. USDA Forest Service, Remote Sensing Applications Center, http://fsweb.rsac.fs.fed.us
Solution • Calculated mean standard deviations on bands 1, 2, 3, 4, 7. Bands 5 & 6 were excluded due to Terra and Aqua banding. • High standard deviations in 5x5 window of 250 m pixel = potential border pixel with cloud. USDA Forest Service, Remote Sensing Applications Center, http://fsweb.rsac.fs.fed.us
Problem: Shadows • Tried a lot of different things such as • Thresholding • Using tassel cap brightness as a shadow indicator • Various unsupervised classification techniques USDA Forest Service, Remote Sensing Applications Center, http://fsweb.rsac.fs.fed.us
Solution: • Sum bands 1, 2, and 4 and rank the sums • The higher the ranking, the greater the likelihood of no shadows. Bandwidth units = nm Spectral Radiance = W/m2 -µm-sr SNR = Signal-to-noise ratio USDA Forest Service, Remote Sensing Applications Center, http://fsweb.rsac.fs.fed.us
Selecting The Pixel To Composite If an 8-day composite was being created NDVI Values 0.539 0.574 0.540 0.412 0.552 0.102 0.032 0.559 NDVI values are within + .10. Any of these days could be used for the composite. USDA Forest Service, Remote Sensing Applications Center, http://fsweb.rsac.fs.fed.us
Selecting The Pixel To Composite If an 8-day composite was being created NDVI Values 0.539 0.574 0.540 0.412 0.552 0.102 0.032 0.559 Mean Focal (5x5) Standard Deviation Values 324 471 214 220 302 1300 130 396 Of the five pixels with high NDVI values, this pixel has the lowest standard deviation. USDA Forest Service, Remote Sensing Applications Center, http://fsweb.rsac.fs.fed.us
Selecting The Pixel To Composite If an 8-day composite was being created NDVI Values 0.539 0.574 0.540 0.412 0.552 0.102 0.032 0.559 Mean Focal (5x5) Standard Deviation Values 324 471 214 220 302 1300 130 396 Ranking of sum of bands 1, 2, 4 70 80 60 70 60 100 100 80 Of the five pixels with high NDVI values, these pixels have the highest ranking. USDA Forest Service, Remote Sensing Applications Center, http://fsweb.rsac.fs.fed.us
Selecting The Pixel To Composite If an 8-day composite was being created NDVI Values 0.539 0.574 0.540 0.412 0.552 0.102 0.032 0.559 Mean Focal (5x5) Standard Deviation Values 324 471 214 220 302 1300 130 396 Ranking of sum of bands 1, 2, 4 70 80 60 70 60 100 100 80 USDA Forest Service, Remote Sensing Applications Center, http://fsweb.rsac.fs.fed.us
Selecting The Pixel To Composite If an 8-day composite was being created 0.559 • The date for these pixels would be used for the composite because: • High NDVI • Standard deviation is reasonable. • High ranking for the sum of bands 1,2,4. 396 80 USDA Forest Service, Remote Sensing Applications Center, http://fsweb.rsac.fs.fed.us
AQUA MODIS Composite 17 May – 1 Jun 2010 Surface Reflectance (bands 2,1,4) USDA Forest Service, Remote Sensing Applications Center, http://fsweb.rsac.fs.fed.us
AQUA MODIS Composite 17 May – 1 Jun 2010 Dates USDA Forest Service, Remote Sensing Applications Center, http://fsweb.rsac.fs.fed.us
AQUA MODIS Composite 17 May – 1 Jun 2010 Dates (Filtered) USDA Forest Service, Remote Sensing Applications Center, http://fsweb.rsac.fs.fed.us
2010 Hotspots Louisiana Forest Tent Catepillar and Baldcypress Leafroller
2010 Hotspots Pennsylvania Forest Tent Catepillar Louisiana Forest Tent Catepillar and Baldcypress Leafroller
2010 Hotspots Michigan Forest Tent Catepillar Pennsylvania Forest Tent Catepillar Louisiana Forest Tent Catepillar and Baldcypress Leafroller
2010 Hotspots Michigan Forest Tent Catepillar Pennsylvania Forest Tent Catepillar Mississippi tornado Louisiana Forest Tent Catepillar and Baldcypress Leafroller
MODIS Composite Date: March 22 – April 6 Polygons are aerial survey results from April 24, 2010
Pennsylvania Forest Tent CatepillarMODIS Composite Date: Apr 15 – Apr 30
Pennsylvania Forest Tent CatepillarMODIS Composite Date: Apr 23 – May 8
Pennsylvania Forest Tent CatepillarMODIS Composite Date: May 1 – May 16
Michigan Forest Tent CatepillarMODIS Composite Date: 15 Apr – 30 Apr
Michigan Forest Tent CatepillarMODIS Composite Date: 23 Apr – 8 May
Michigan Forest Tent CatepillarMODIS Composite Date: 1 May – 16 May
Detecting 2010 storm damage • Tracking tornado and wind reports on NWS Storm Prediction Center Website: http://www.spc.noaa.gov/climo/reports/ • 6 big storm activity days (in forested regions) so far in 2010: 4/24/10 4/30/10 5/1/10 5/10/10 5/12/10 5/19/10 • 197 tornado reports • 428 wind reports
Mississippi tornado (April 24, 2010)MODIS Composite Date: 23 Apr – 8 May
Mississippi tornado (April 24, 2010)MODIS Composite Date: 1 May – 16 May
The End Comments/Questions? USDA Forest Service, Remote Sensing Applications Center, FSWeb: http://fsweb.rsac.fs.fed.us WWW: http://www.fs.fed.us/eng/rsac/