Understanding Color Changes in Candlestick Indicators for Trend Analysis
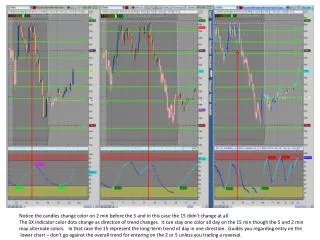
This guide explains the behavior of candlestick indicators on different timeframes, particularly focusing on the 2-minute, 5-minute, and 15-minute charts. It highlights how candles change color two minutes before the 5-minute mark and why the 15-minute candle may not change at all. The 3X indicator's color dot changes reflect the trend's direction, maintaining a single color on the 15-minute chart. This analysis aids in making informed entry decisions on lower timeframes while respecting the overarching long-term trend.

Understanding Color Changes in Candlestick Indicators for Trend Analysis
E N D
Presentation Transcript
Notice the candles change color on 2 min before the 5 and in this case the 15 didn’t change at all. The 3X indicator color dots change as direction of trend changes. It can stay one color all day on the 15 min though the 5 and 2 min may alternate colors. In that case the 15 represent the long-term trend of day in one direction. Guides you regarding entry on the lower chart – don’t go against the overall trend for entering on the 2 or 5 unless you trading a reversal.