Writing WinDbg Extensions
Writing WinDbg Extensions. Andre Vachon Software Development Lead Windows Product Feedback Microsoft Corporation. Agenda. What are Debugger Extensions How do they work Extension APIs Legacy debugger extension APIs New DbgEng extension APIs 64-bit Sample code.


Writing WinDbg Extensions
E N D
Presentation Transcript
Writing WinDbg Extensions Andre Vachon Software Development Lead Windows Product FeedbackMicrosoft Corporation
Agenda • What are Debugger Extensions • How do they work • Extension APIs • Legacy debugger extension APIs • New DbgEng extension APIs • 64-bit • Sample code
What Are Debugger Extensions • Lets you write your own debugger commands • Great for automation • Helps you streamline common debugging operations • Can help analyze complex structures • Simple structures can be dumped and analyzed using the dt debugger command; No need to write extensions for this • Complex trees and lists can be displayed, searched, and parsed to show the most commonly used information • Windows DEV team could not debug the OS without debugger extensions • Lots of complex structures to look at • Important to help find corruption in structures • We have written hundreds of these: !process, !thread, !handle, !teb, !peb, !vad
Debugger Extension Programming Model • Debugger extensions are DLLs loaded by the debugger using LoadLibrary • Debugger extensions run in the context of the debugger process (WinDbg) • Debugger extensions are trusted by the debugger • A simple try – except is placed around execution of extensions to recover from AVs • Heap corruption in an extension will cause the debugger to crash • A debugger extension can make calls to • Debugger interfaces (dbgeng.dll) • Calls to any other DLL are risky and should be avoided if possible • Must be careful of interactions between Win32 APIs and dbgeng\dbghelp APIs • Calling dbghelp APIs directly can change internal state DbgEng relies on • Any Win32 API can be called – APIs run in the context of the WinDbg process • ReadProcessMemory could return different data than calling the debugger to read memory from the target process • Debugger extensions run on the host debugger • In remote debugging scenarios, input\output is sent over the wire
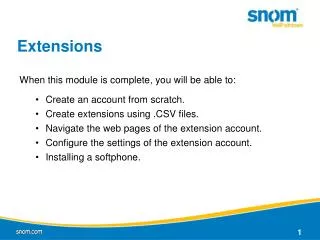
Debugger Extension Execution Model Target/Debuggee Process Host: Debugger Process No! Debugger Extension My App Extension Interfaces My Dll 1 WinDbg My Dll 2 UserMode : I . P. C. Kernel Mode: Debug Port
Debugger Extension And Remote Debugging Host: Debugger Process Remote Debugger User Input Debugger Extension Extension Interfaces WinDbg WinDbg Remote Debugging Protocol Named Pipes, TCP
User Mode, Kernel Mode, Dump Files • Debugger extension can work with any type or version of target • The debugger API abstracts the “target” as much as possible • All basic extension APIs work on live sessions or dump files, user mode or kernel mode targets, and any version of the OS • Certain specific operations or data may not make sense on all targets • Examples • Breakpoints won’t work on dump files • ReadPhysicalMemory is not supported for user mode targets • Debugger extensions must gracefully handle errors • The debugger package organizes its extensions based on what targets they support • Ext.dll – extensions that work for both user mode and kernel mode (!analyze, !error, !list) • Uext.dll – user-mode only extensions (!runaway, !evlog) • Kext.dll – kernel-mode only extensions (!pci, !process)
Legacy (Old) Debugger Extension Interfaces • Often referred to as Old Style or WDbgExts extensions • Continued to be fully supported by dbgeng.dll • Definitions can be found in wdbgexts.h • Exposes limited functionality that enabled most common features • Read and write memory • Current process \ Thread information • Expression evaluation • Basic symbol lookup • Basic type lookup • Crtl-C/Ctrl-Break • Extensions functions are called by • Asking the debugger engine for a table containing debugger extension function pointers • Making calls through these function pointers
New Debugger Interfaces • Often referred to as DbgEng style extensions • Debugger engine exposes a new, complete set of interfaces • Everything that can be performed by a debugger is exposed by the interface • Referred to as the DbgEng API • WinDbg is built on top of this API • All debugging capabilities are exposed through dbgeng.dll • Can write new standalone tools that call the interface • Debugger extension DLLs are generally more convenient in most scenarios • Functionality supported by the DbgEng API • Read and write memory • Current thread and process information • Expression evaluation • Full symbol lookup and enumeration • Full type lookup and enumeration • General target information • Extensions functions are called by • Creating debug interface objects • Calling the engine interfaces exposed by these objects • Breakpoints • Source code support • Rich output control • Initialization and instantiation • Module enumeration • Version information • Execution control
Legacy Extension Initialization • Legacy extension DLLs need to export the following entry points from the DLL • WinDbgExtensionDllInit – Required • ExtensionApiVersion – Required • CheckVersion – Optional • The debugger finds entry points using GetProcAddress on the extension DLL • Entry Points are called all DLL initialization • No Uninitialize routine in the legacy extension model typedef VOID (WDBGAPI*PWINDBG_EXTENSION_DLL_INIT)( PWINDBG_EXTENSION_APIS lpExtensionApis, USHORT MajorVersion, USHORT MinorVersion); typedef LPEXT_API_VERSION (WDBGAPI*PWINDBG_EXTENSION_API_VERSION)( VOID); typedef ULONG (WDBGAPI*PWINDBG_CHECK_VERSION)( VOID);
New Extension Initialization • New extension DLLs need to export the following entry points from the DLL • DebugExtensionInitialize • DebugExtensionNotify • DebugExtensionUninitialize • An extension cannot export both new and old entry points from its DLL • The debugger finds entry points using GetProcAddress on the extension DLL • DebugExtensionNotify is called when the target is connected or disconnected typedef HRESULT (CALLBACK* PDEBUG_EXTENSION_INITIALIZE) (OUT PULONG Version, OUT PULONG Flags); typedef void (CALLBACK* PDEBUG_EXTENSION_UNINITIALIZE) (void); typedef void (CALLBACK* PDEBUG_EXTENSION_NOTIFY) (IN ULONG Notify, IN ULONG64 Argument);
Getting Debugger Extension APIs • Legacy debugger extensions get legacy extension interfaces (function pointers) during initialization as part of init call (param1) • Pointers must be cached in a global variable named ExtensionApis • New debugger extensions get new debugger interfaces by calling • DebugCreate(__uuidof (IDebugClient), &DebugClient)) • DebugClient->QueryInterface(_uuidof(Interface_you_want) • New debugger extensions can also query for the legacy extension interfaces • Legacy extension interfaces can not be remoted • DebugClient->QueryInterface(_uuidof(IDebugControl), &DebugControl) • DebugControl->GetWindbgExtensionApis64(&ExtensionApis);
Input – Argument Parsing • Debugger extensions receive arguments as one long text string • Extensions can parse parameters any way they want • Extension will be given all output up to a ‘;’ character, unless quoted • ‘;’is a delimiter between multiple, independent debugger commands • Debugger provides routines to help parse arguments • Legacy Interfaces: GetExpression(), GetExpressionEX • New interfaces: Evaluate() • These interfaces do both argument parsing and evaluation of arguments • Strings will be treated as symbol • ‘-’ will be treated as minus • Recommendations • Add /h to provide help
Output • Standard debugger extension output is text-based • Output control, Extension functions are common exceptions • Extensions can generate their own UI – not recommended • Standard output format very similar to C-runtime • %s, %d, specifiers, etc • Special pointer specifier %p • Always consumes 64 bit input (always use ULONG64) • Prints 32 or 64 bits based on the target OS • Legacy Interface • New Interface #define dprintf (ExtensionApis.lpOutputRoutine); Dprintf(“pointer =%p, string=%s”, (ULONG64) pointer, (LPSTR string); g_ExtControl->Output(Mask, Format,...);
Output Control • The debugger interfaces have rich support for output control; What is it ? • Allows the application to capture or modify output before it gets displayed • Allows for special formatting in windows, such as the stack window • Allows filtering to only display certain types of messages (errors, warnings) • KD and WinDbg use output control. Can also be used by extensions • OutputControl is associated with a client (queried interfaces) • Extensions should respect output control setup by these applications • If extensions don’t have specific output control needs, they should inherit them from the caller • A new style extension should query interfaces each time an extension API is called (and then release them at the end of each call) to inherit the OutputControl from the calling thread
Symbol Lookup • Use symbols to lookup data in your driver • Always use a module qualifier when evaluating a symbol • Example: mydriver!data • Without a module qualifier, the debugger will load all symbol files until it finds a module with a symbol data • Avoid caching evaluated symbols (in global variables) • Driver can load and unload, and extensions are not notified of such events; Once a PDB is loaded, a symbol lookup is not very expensive • Legacy interfaces • Get an address from a name: GetExpression() • Get a name from an address: GetSymbol() • New Interfaces • Get an address from a name: Evaluate(), GetOffsetByName() • Get a name from an address: GetNameByOffset()
Reading Memory • Most code uses the built-in ReadMemory macro with legacy debugger extension interfaces for memory reading • Reading raw memory should be a rare occurrence in a debugger extension • Use more structured memory reading operations • These APIs read memory on the target process \ machine • To read data that will be interpreted as pointers, use #define ReadMemory (ExtensionApis.lpReadProcessMemoryRoutine) Typedef ULONG (WDBGAPI*PWINDBG_READ_PROCESS_MEMORY_ROUTINE64)( ULONG64 offset, PVOID lpBuffer, ULONG cb, PULONG lpcbBytesRead); IDebugDataSpaces STDMETHOD(ReadVirtual)( THIS_ IN ULONG64 Offset, OUT PVOID Buffer, IN ULONG BufferSize, OUT OPTIONAL PULONG BytesRead); ReadPointer(ULONG64 Address, PULONG64 Pointer);
64-Bit Support • Everything in the debugger and debugger extension are designed around 64-bit support • All recent debugger APIs treat addresses as 64-bit values • All pointers are passed as ULONG64 • Debugger manipulates all addresses as 64-bit values • Debugger extensions should too • 32-bit addresses read from a 32-bit target need to be SIGN-EXTENDED • Why ? • We use 32 bit machines to debug 64 bit targets • On 32 bits *anything = 4 bytes • On 64 bits *anything = 8 bytes • If we used Pointers to store addresses, we would always lose the top 4 bytes of addresses coming back from 64-bit targets • #define KDEXT_64BIT required before including wdbgexts.h • Set Version number to EXT_API_VERSION_NUMBER64
On a 32-bit machine (x86) PVOID is 32 bits ULONG is 32 bits ULONG64 is 64 bits On a 64-bit machine (amd64, IA64) PVOID is 64 bits ULONG is 32 bits ULONG64 is 64 bits Debugger extensions are compiled executable code running on the HOST Host uses one size or the other To support 64-bit debugging, a 32 bit host must be able to debug a 64-bit target How to deal with this problem? TypeInformation 64 Bits And Structures typedef struct { } FOO
What Is Type Information • Type information refers to the encoding of the structure definitions (structs, classes) by the compiler and linker • Only structured types are stored • Strings for constants (#define) are not saved in the PDB; They are thrown away by the preprocessor • Enum are saved by the latest compiler and linker • Only data actually used by the code (Enum, structures) are stored in the PDB • Type information is data stored in the PDB file • One of the data streams stored in the PDB file • Always saved away by the compiler and linker • PDB is regenerated with every linking of an image • PDBs released by Microsoft do not contain type information in the general case • PDBs are “stripped” before being released • Type information is too large • Type information contains lots of Intellectual property • Some type information is re-added to certain binaries, like ntoskrnl.exe, to support debugger extensions
Using Type Information • Type information solves the 32/64-bit issue for debugger extensions • Dynamically use the type descriptions stored in the PDB to analyze the data structures read from the target • This works because • The debugger treats all addresses as 64 bits and truncates appropriately when reading from a 32-bit target • Compiler and linker keep the same type names, whether compiling 32 or 64 bits • Symbol files are matched up to the target code • Limitations • Requires good symbols – few developers look at debugging sessions without good symbols anyway
Using Type Information • Legacy GetFieldValue() command • Macro in wdbgexts.h • Legacy InitTypeRead() and ReadField() commands • Used when large structures need to be read\analyzed • Code simplification over GetFieldValue() • InitTypeRead() sets some global state about the current data structure • ReadField() reads a field of that structure from the target into a local variable • New Interfaces have numerous APIs to enumerate types and variables • The IDebugSymbols class encapsulates these routines • All TARGET addresses and pointers in a debugger extension must • Be signed extended if coming from 32 bit • Be stored as ULONG64 • Use ReadPointer() and GetFieldValue() GetFieldValue(ULONG64 Address, LPSTR Type, LPSTR Field, ULONG64 Value);
Control–C • Control-C handling is shared between the core debugger code and the extension • Generate by Ctrl-C in command line debuggers, Ctrl-Break in WinDbg • Debugger engine will • The IO thread in the debugger will receive the Ctrl-C • The engine stores the state of this event in a global variable • Debugger extension must check this state • Only one thread in the debugger processes command; The debugger extension takes over this thread • Debugger can not kill the extension thread • Debugger extension must call the engine to check the state and exit its processing
Extension Functions • Most extensions commands run from the debugger generate text output • Example: !pool, !process, !analyze • The debugger also supports debugger extensions functions • Example: _EFN_GetPoolData • Output : ‘C’ data structure that can be consumed by the caller • Extension functions are defined in extsfns.h • Allows powerful extensions to be built using other debugger extensions, without text parsing • Exported from a DLL like other extension commands • _EFN_ is the convention for exporting these functions to distinguish them from normal debugger extension commands • Debugger engine automatically appends this prefix • GetExtensionFunction equivalent to GetProcAddress g_ExtControl->GetExtensionFunction(0, "GetPoolData",(FARPROC*)&pGetPoolData); (*pGetPoolData)((PDEBUG_CLIENT)g_ExtClient, Pool, pPoolData);
How To Get Started • All documentation about existing debugger extensions (!pool, !thread, !process) is in the basic debugger documentation • Installed by default in the root of the debugger in debugger.chm • All documentation about debugger extension APIs and all debugger extension code samples are part of the debugger • Not installed by default – you must select the “SDK” component when doing the debugger install • Docs are called debugext.chm (only partially done at this time) • Samples are stored by default under the samples directory • Use the samples we provide • Simpleext • Uses legacy extension APIs • Dumps basic data structures • Exts • Uses new DbgEng API
New Style Or Legacy Style Extensions? • Legacy extensions work fine in the new debugger • No extension DLL is required to switch to new style interfaces • Legacy extensions require a little less code to write • More simple macros are available • Initialization is a little less complex • Great for very simple code • New extension APIs Provide more flexibility and features • Many more features • Fine grain control over debugger behavior • Can still use legacy interfaces and macros for part of the code • Recommend using C++ for new style extensions
Resources • Debugger URL and download site • http://www.microsoft.com/whdc/ddk/debugging • Debugger e-mail – for debugger bug reports and feature requests • windbgfb @ microsoft.com • We try to fix all the bugs people report • We do not provide general debugging support on this alias • Debugger newsgroup • Microsoft.public.windbg • Good place for general debugging issues