Download
1 / 1
20 likes | 368 Views
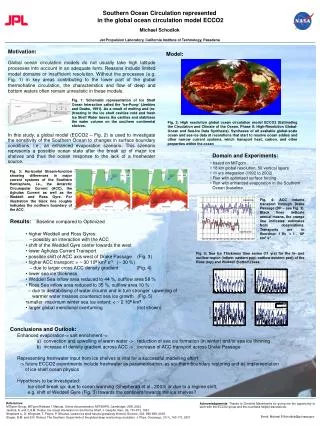
BL. OP. Ross Gyre. Southern Ocean Circulation represented in the global ocean circulation model ECCO2. Michael Schodlok. Jet Propulsion Laboratory, California Institute of Technology, Pasadena. Motivation:

E N D
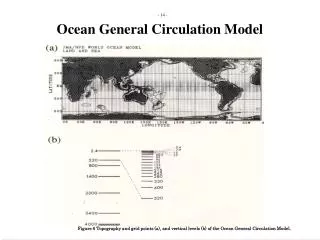
BL OP Ross Gyre Southern Ocean Circulation represented in the global ocean circulation model ECCO2 Michael Schodlok Jet Propulsion Laboratory, California Institute of Technology, Pasadena Motivation: Global ocean circulation models do not usually take high latitude processes into account in an adequate form. Reasons include limited model domains or insufficient resolution. Without the processes (e.g. Fig. 1) in key areas contributing to the lower part of the global thermohaline circulation, the characteristics and flow of deep and bottom waters often remain unrealistic in these models. Model: Fig. 1: Schematic representation of Ice Shelf Ocean Interaction called the ‘Ice-Pump’ (Jenkins and Doake, 1991). As a result of melting and (re-)freezing in the ice shelf cavities cold and fresh Ice Shelf Water leaves the cavities and stabilises the water column on the southern continental shelves. Fig. 2: High resolution global ocean circulation model ECCO2 (Estimating the Circulation and Climate of the Ocean, Phase II: High-Resolution Global-Ocean and Sea-Ice Data Synthesis). Syntheses of all available global-scale ocean and sea-ice data at resolutions that start to resolve ocean eddies and other narrow current systems, which transport heat, carbon, and other properties within the ocean In this study, a global model (ECCO2 – Fig. 2) is used to investigate the sensitivity of the Southern Ocean to changes in surface boundary conditions, i.e., an enhanced evaporation szenario. This szenario represents a possible ocean state after the break up of major ice shelves and thus the ocean response to the lack of a freshwater source. Domain and Experiments: • based on MITgcm • 18 km global resolution, 50 vertical layers • 11 yrs integration (1992 to 2002) • Run with optimised surface forcing • Run with enhanced evaporation in the Southern Ocean (baseline Fig. 3: Horizontal Stream-function showing differences in major current systems of the Southern Hemisphere, i.e., the Antarctic Circumpolar Current (ACC), the Aghulas Current as well as the Weddell and Ross Gyre. For illustration the black line roughly indicates the northern boundary of the ACC. Fig. 4: ACC volume transport through Drake Passage (DP – see Fig. 3). Black lines indicate annual means, the orange line indicates estimates from observations. Transports are in Sverdrup: 1 Sv = 1 · 106 km3 s-1 Results: Baseline compared to Optimized • higher Weddell and Ross Gyres: – possibly an interaction with the ACC • shift of the Weddell Gyre center towards the west • lower Aghulas Current Transport • possible shift of ACC axis west of Drake Passage (Fig. 3) • higher ACC transport: > ~ 30 106 km3s-1 (~ 30 %) – due to larger cross ACC density gradient (Fig. 4) • lower sea ice thickness • Weddell Sea inflow area reduced to 44 %, outflow area 58 % • Ross Sea inflow area reduced to 35 %, outflow area 10 % – due to destabilising of water cloumn and in turn stronger upwelling of warmer water masses counteract sea ice growth (Fig. 5) • smaller maximum winter sea ice extent: < ~ 2 106 km2 • larger global meridional overturning (not shown) Fig. 5: Sea Ice Thickness time series (11 yrs) for the in- and outflow region (inflow: eastern part, outflow western part) of the Ross (top) and Weddell (bottom) seas. Conclusions and Outlook: Enhanced evaporation-> salt enrichment -> a) convection and upwelling of warm water -> reduction of sea ice formation (in winter) and/or sea ice thinning b) increase of density gradient across ACC -> increase of ACC transport across Drake Passage Representing freshwater input from ice shelves is vital for a successful modelling effort -> future ECCO2 experiments include freshwater as parametrisation, as southern boundary restoring and as implementation of ice shelf ocean physics Hypothesis to be investigated: Ice shelf break up: due to ocean warming (Shepherad et al., 2003) or due to a regime shift, e.g. shift of Weddell Gyre (Fig. 3) towards the continent/towards the ice shelves? References: MITgcm-Group, MITgcm Release 1 Manual, Online documentation, MIT/EAPS, Cambridge, USA, 2002 Jenkins, A. and C.S.M. Doake, Ice-ocean interaction on the Ronne Shelf, J. Geophs. Res., 96, 791-813, 1991 Shepherd a., D. Wingham, T. Payne, P. Skvarva, Larsen ice shelf has progressively thinned, Science, 302, 856-859, 2003 Sloyan, B.M. and S.R. Rintoul, The Southern Ocean limb of the global deep overturning circulation. J. Phys. Oceanogr., 31(1), 143-173, 2001 Acknowledgements: Thanks to Dinmitris Menemenlis for giving me the opportunity to work with the ECCO2 group and the countless helpful discussions. Email: Michael.P.Schodlok@jpl.nasa.gov