Spatial Processing in R
Spatial Processing in R. Luke Winslow. Task. Calculate a buffer around a lake Create a Shapefile for just the buffer Extract Land/Cover Land/Use for buffer from n ational database. Lake Mendota. mendota = readOGR ('.',' mendota ')

Spatial Processing in R
E N D
Presentation Transcript
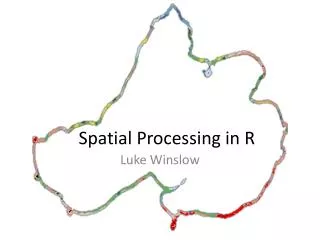
Spatial Processing in R Luke Winslow
Task • Calculate a buffer around a lake • Create a Shapefile for just the buffer • Extract Land/Cover Land/Use for buffer from national database
Lake Mendota mendota = readOGR('.','mendota') mendotaProj = spTransform(mendota,CRS("+proj=cea")) plot(mendotaProj)
Buffer Shape mendotaBuffer = gBuffer(mendotaProj,width=100) plot(mendotaBuffer)
Combining Shapes # Now we need to turn the original mendota # shape into holes for the buffer newHoles = mendotaProj@polygons[[1]]@Polygons #Reverse each to make holes filled and vice-versa for(i in 1:length(newHoles)){ #Tell the polygon to switch being hole/not hole newHoles[[i]]@hole = !newHoles[[1]]@hole #reverse direction of coordinates (also means hole/not hole) newHoles[[1]]@coords = apply(newHoles[[1]]@coords,2,rev) }
nlcd = raster(nlcdPath) meBuffProj = spTransform(mendotaBuffer,nlcd@crs) nlcdCropped = crop(nlcd,meBuffProj) #This is the buffer with the NLCD raster overlaid plot(nlcdCropped,add=T) plot(meBuffProj,add=T,lwd=2)
meMasked = mask(nlcdCropped,meBuffProj) meMasked@legend = nlcd@legend plot(meMasked)
Success! freq(meMasked) value count [1,] 11 442 Open Water [2,] 21 377 Developed, Open [3,] 22 1166 Developed, Low [4,] 23 328 Developed, Medium [5,] 24 50 Developed, High [6,] 41 1048 Deciduous Forest [7,] 42 138 Evergreen Forest [8,] 43 25 Mixed Forest [9,] 52 6 Scrub [10,] 71 2 Grassland/Herbacious [11,] 81 255 Pasture/Hay [12,] 82 33 Cultivated Crop [13,] 90 285 Woody Wetland [14,] 95 175 Emergent Herb. Wetland