Validity in Statistics
Validity in Statistics. Unit 2, Day 8. By the end of the period…. I can state the reason that valid data and reporting of data is imperative in statistics. I can identify sources of valid data, including government publications, etc. I can interpret the meaning of margin of error.

Validity in Statistics
E N D
Presentation Transcript
Validity in Statistics Unit 2, Day 8
By the end of the period… • I can state the reason that valid data and reporting of data is imperative in statistics. • I can identify sources of valid data, including government publications, etc. • I can interpret the meaning of margin of error.
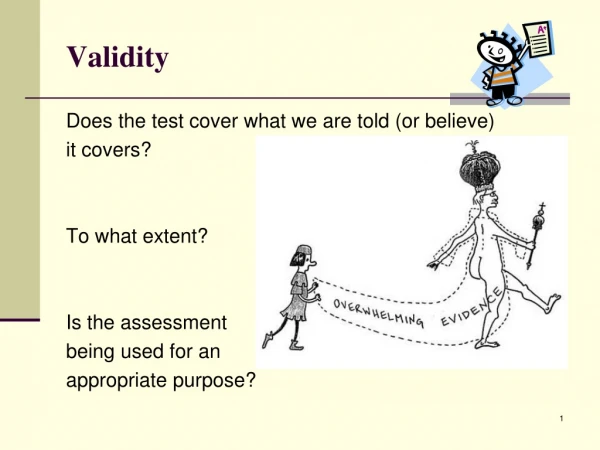
Validity in Statistics Validity is the reliability of the research and the data. It tells us how valid the results are, specifically “Does this measure what it says it does?”. In order to be confident in what we are reading, we need to critically evaluate the validity of the statements.
Cross-sectional vs Longitudinal Studies • Cross-sectional study: considers individuals from different groups at the same time (eg. different grade levels). Cross-sectional studies are cheaper and quicker than longitudinal studies • Longitudinal study: considers individuals over a long period of time (eg. cancer patients from diagnosis through to treatment). Longitudinal studies allow you to make conclusions over time that may not be addressed via a cross-sectional study.
Reading… Large digital-skills divide among Canadian adults, OECD study shows
Questions 1. What is your initial impression of this article? Do you agree with the title? Explain. 2. For this study, • State the population for this study. • State the sample for this study. • Is the sample a reflection of the population?
Questions, cont… 3. For the study on digital competency, • What question does the study attempt to answer? • What biases (other influences) may have existed in his study? • According to the article, what were some variables that were recorded? • For each variable in (c), state if they are qualitative or quantitative. If they are quantitative state if they are discrete or continuous. • Would this have been a longitudinal or a cross-sectional study? Explain. • Would it have been an experimental or observational study? Explain. 4. Discuss the validity of this article.
Trusted Professions Study • Conducted by Leger Marketing, May 2007 • Not conducted again by them since • Other companies have conducted similar studies, including Reader’s Digest & Ipsos Reid
Margin of Error (write this) Margin of Error means that if a study were repeated 20 times, with 20 different samples of of the same size, in 19 of those studies, the values found would be the same within that stated percent. For this, Firemen were 97%. So, the values would range from 97-2.6% = 94.4% (Lowest value) 97+2.6% = 99.6% (Highest value)
Comparable Study • IpsosReid conducted a similar study also in 2007. • We can compare results to the Leger Marketing study. • Highlights include: The Most Trustworthy Professions • firefighters (93%) • nurses (87%) • pharmacists (86%) • airline pilots (81%) • doctors (80%)
Comparable Study… • More highlights: Least Trustworthy Professions • Chief Executive Officers (CEOs) (21%), • trade unions (19%) • local (12%) • national politicians (7%), and car salespeople (7%).
Margin of Error for the Study These are the findings of an Ipsos-Reid poll conducted from Dec 21-27th, 2006 via a regionally representative online Canadian sample of 1000 adult Canadians. For this sample, results can be considered accurate 95% of the time with a 3.1% margin of error, of what it would have been had this entire population been surveyed.
Rick’s Rant -- Pollsters • Rick Mercer is a noted Canadian comedian who has been “ranting” about various things for the last 20 years. • On September 25th, 2012, Rick had his own rant on pollsters and their ability to predict election results. • Watch the following and be ready to discuss his thoughts: Rick's Pollster Rant