STATISTICS (reliability, validity, data)
STATISTICS (reliability, validity, data). What's the point of research??. Research is important for many reasons not least for the following: Research allows you knowledge, without knowledge, based upon research, you just have an argument, or an opinion…it’s all assumptions!!!. RELIABILITY.

STATISTICS (reliability, validity, data)
E N D
Presentation Transcript
What's the point of research?? • Research is important for many reasons not least for the following: • Research allows you knowledge, without knowledge, based upon research, you just have an argument, or an opinion…it’s all assumptions!!!
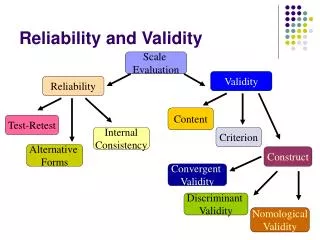
RELIABILITY • If a bus arrived every morning at 8.30am….you would keep using this service wouldn’t you? • Conversely if the bus service was erratic…I.e. You couldn’t estimate when it arrived..you would not use it, because it wasn't consistent. • Thus reliability is a measure of consistency
RELIABILITY There are several ways you could test the reliability of a measurement each come with their own limitations!! • Split half reliability.Complete a correlation between the first half of the sample and the second half. • Test retest reliability. Test the participants once, calculate a correlation, then retest the participants again. The higher the co-efficient, the higher the reliability • Odd even reliability. Compare the correlation between the odd numbers and even numbers.
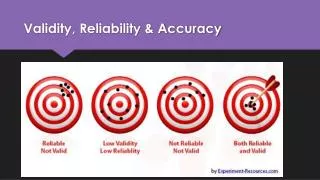
VALIDITY….. There are two main types of validity: External: The extent to which the results can be generalised to the population and other settings. Internal: Can the results be attributed to the manipulation of the IV or were there other factors that effected the results.
Descriptive Statistics. • Psychologists summarise their data numerically through • Levels of data • Measures of Central tendency • Measures of Dispersion.
Levels of data Nominal data Ordinal data interval/ratio Interval data is continuous data where differences are interpretable, but where there is no "natural" zero. categorical data where the order of the categories is arbitrary categorical data Where there is a logical ordering Ethnic monitoring 1= Black 2= White. Likert scale 1= agree, 2=disagree temperature
Measures of Dispersion. • Range = The difference between the smallest and the largest value, plus 1. E.g. 4 7 7 8 9 (9-4)+1= Range of 6. • Standard Deviation= The average amount all scores deviate from the mean. • (Next 2 slides give an example of how to calculate the SD.)
Standard deviation. • The standard deviation is the distribution of scores among the data and also happen to be the most frequent scores. • The purpose of calculating the SD is to discover how many of the scores deviate from the average (think of the curve of normal distribution!!) • In order to decide whether results gained from research are trustworthy we take into account the validity of the results.
SCORE MEAN D D (squared) 6 10 -4 16 8 10 -2 4 10 10 0 0 12 10 +2 4 14 10 +4 16 Standard Deviation explained…
Step 1: Workout the mean of the scores by adding all values and divide by number Total = 50/5=10.thus the mean is 10. Step 2: Minus the mean from the score (doesn’t matter if you get Minus numbers as the mean of these numbers are squared to get rid of the minus). Step 3: Add the squared values to get a total. Mean of the total (40 = 8, this is the variance of the square root of variance.) Step 4 : the square root of the variance is calculated and this gives you the standard deviation