Download
1 / 34
340 likes | 451 Views
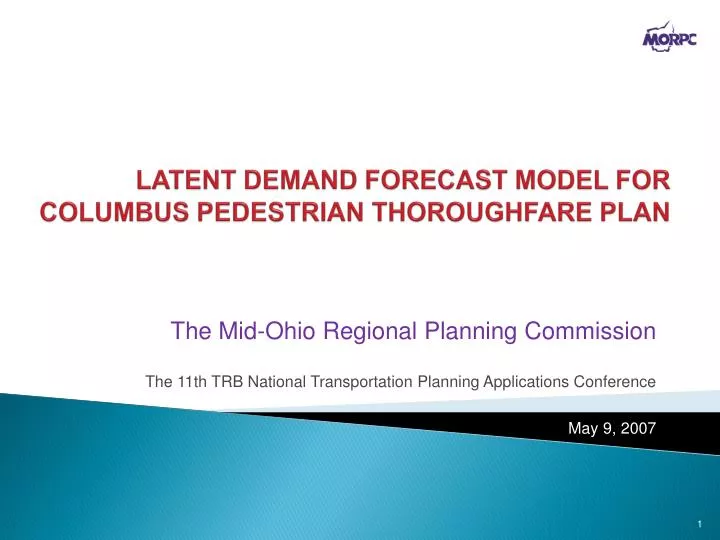
LATENT DEMAND FORECAST MODEL FOR COLUMBUS PEDESTRIAN THOROUGHFARE PLAN. The Mid-Ohio Regional Planning Commission The 11th TRB National Transportation Planning Applications Conference May 9, 2007. Acknowledgements. City of Columbus Maricopa Association of Governments (MAG)

E N D
LATENT DEMAND FORECAST MODEL FOR COLUMBUS PEDESTRIAN THOROUGHFARE PLAN The Mid-Ohio Regional Planning Commission The 11th TRB National Transportation Planning Applications Conference May 9, 2007
Acknowledgements • City of Columbus • Maricopa Association of Governments (MAG) • Central Ohio Transit Authority
Outline • Columbus Pedestrian Thoroughfare Plan • Review of MAG Latent Demand Model • MORPC’s Modification • Results • Conclusions
Outline • Columbus Pedestrian Thoroughfare Plan • Review of MAG Latent Demand Model • MORPC’s Modification • Results • Conclusions
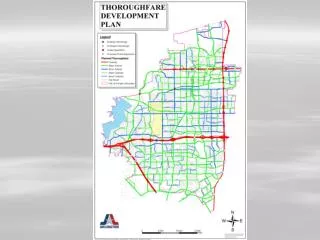
Pedestrian Thoroughfare Plan • Identify major pedestrian network • Recognize pedestrian travel needs • Promote pedestrian activities
Outline • Columbus Pedestrian Thoroughfare Plan • Review of MAG Latent Demand Model • MORPC’s Modification • Results • Conclusions
Latent Demand ModelMaricopa Association of Governments (MAG) • “Gravity-based” Model • Non-linked vs. Linked • Latent Demand Score (LDS): 0~100% Relative levels of potential pedestrian travel demand among a given network
P P P A P P P P P “Gravity-based” Model Both ends of walk trips • Attraction • Production A
“Gravity-based” Model (Cont’d) Distance matters Source: MAG Pedestrian 2000-Technical Appendix, Dec 1999
P P P P P A P P P “Gravity-based” Model (Cont’d) Spatial queries • Buffer A
Attractor-base queries Segment-based queries “Gravity-based” Model (Cont’d)
Attractor-base queries Segment-based queries “Gravity-based” Model (Cont’d)
Non-linked vs. Linked • Non-linked trips: entire trip made by foot • Work (college/University) • Shopping and Errands • School • Recreational • Linked trips: partial trip made by foot (most of the trip made by auto/other motorized modes)
Latent Demand Score • LDS - normalization 0 ~ 100% • Non-linked • Linked • Combine non-linked and linked trips “Composite” LDS=MAX(non-linked LDS, Linked LDS)
Outline • Columbus Pedestrian Thoroughfare Plan • Review of MAG Latent Demand Model • MORPC’s Modification • Results • Conclusions
MORPC’s Modification • Grid System vs. TAZ • Impact of Transit Service • Additional Pedestrian “Attractors”
¼-mile-square Grid System • Regional Connections TAZ Grid
Impact of Transit Service • MAG linked pedestrian trips Linked LDS = E/A • E=total employment within the buffer • A=total area within the buffer • Attraction (employment) end vs. production (residence) end • Auto vs. Transit
Impact of Transit Service (Cont’d) • Revisedlinked pedestrian trips Linked LDS = (Pb%+E)/A • P=total population within the buffer • b%=transit share of trips by the population • E=total employment within the buffer • A=total area within the buffer
Impact of Transit Service (Cont’d) • Transit Share – b% • Mode split information at Block Group (BG) level from Census 2000 SF3 data • Mode split information at Grid level? • Transit Service Frequency by Route at Grid level from Central Ohio Transit Authority (COTA) • Stops in the Grid • Headways
Impact of Transit Service (Cont’d) • Transit Share – b% (cont’d) b%=M% (f / F) • M%= max. BG transit share within the entire region considered. • f= transit service frequency within Grid/its buffer. • F=max. transit service frequency within Grid/its buffer.
Additional Pedestrian “Attractors” • Government buildings, sport arena, museum, libraries, theaters, etc. • Four Categories • Service area (local vs. regional) • Service type (general vs. special)
Additional Pedestrian “Attractors” Four Categories
Additional Pedestrian “Attractors” Weight Score
Additional Pedestrian “Attractors” • Example of weighting factor • Library and Fairground in the buffer of a segment with LDS = 80% Weight score = 3+1=4 Weighting factor = 1.04 (multiplicative) New LDS = 80% 1.04= 83.2%
Outline • Columbus Pedestrian Thoroughfare Plan • Review of MAG Latent Demand Model • MORPC’s Modification • Results • Conclusions
Outline • Columbus Pedestrian Thoroughfare Plan • Review of MAG Latent Demand Model • MORPC’s Modification • Results • Conclusions
Conclusions • Understanding pedestrian travel demand • Evaluating existing sidewalk system (ongoing) • Prioritizing pedestrian facility improvements in a consistent way • Future work: refine methodologies and update the results periodically
Contacts • Ahmad Al-Akhras alakhras@morpc.org • Chris Gawronski cgawronski@morpc.org • Anthony Hull ahull@morpc.org • Zhuojun Jiang zjiang@morpc.org
Questions ? Please use the Microphone. 34