Download

1 / 24
240 likes | 333 Views
Business Economics ( ECO 341) Fall: 2012 Semester. Khurrum S. Mughal. Aggregate Demand and Supply. The Two-Way Relationship Between Output and the Price Level. Aggregate Demand Curve. Price. Real. Level. GDP. Aggregate Supply Curve. AD and AS.

E N D
Business Economics (ECO 341)Fall: 2012 Semester Khurrum S. Mughal
The Two-Way Relationship Between Output and the Price Level Aggregate Demand Curve Price Real Level GDP Aggregate Supply Curve
AD and AS • There exist a two-way relationship between price level and output • Changes in price level cause changes in real GDP – illustrated by Aggregate Demand curve • Changes in real GDP cause changes in price level – illustrated by Aggregate Supply curve
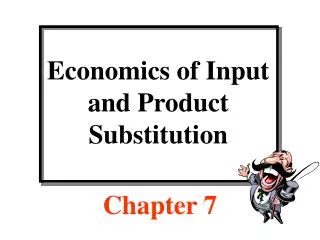
Aggregate Demand • Define aggregate demand as the total demand for an economy’s output (production of goods and services) over a given period of time. • Demand may come from households (consumption), firms (investment), the public sector (government spending) or foreign households, firms, or governments (net exports). • YAD = C + I + G + NX • We assume an inverse relationship between price and aggregate demand
Aggregate Demand Rises as Price Falls • Suppose aggregate prices in the economy fell • This would cause the demand for money to decrease, causing interest rates to decline • Alternatively, the real money supply (M/P) rises, causing interest rates to fall. • With lower interest rates, the opportunity cost of consumption is lower: • P↓ Md↓ i↓ C↑ • With lower interest rates, the direct cost of investment falls: • P↓ Md↓ i↓ I↑ • With lower interest rates a country’s currency will depreciate. A weaker currency makes exports cheaper and imports more expensive • P↓ Md↓ i↓ Exchange Rate↓ NX↑
The Aggregate Demand Curve P 2 1 AD 180 100 Y
Movements Along The AD Curve • A variety of events can cause the price level to change, and move us along the AD curve • It’s important to understand what happens in the economy as we make such a move
Movements Along The AD Curve • Opposite sequence of events will occur if the price level falls, moving us rightward along the AD curve
Effects of Key Changes on the Aggregate Demand Curve Price level ↑ moves us leftward along the AD curve Price level ↓ moves us rightward along the AD curve (a) Price Level P3 P1 P2 AD Real GDP Q3 Q1 Q2
Factors that Shift the AD Curve • Anything (other than price!) that causes C, I, G, or NX to increase will shift the AD curve to the right. • C increases when… • There is an increase in consumer confidence, leading to more current consumption and less current savings • Taxes are cut leaving consumers with more income to spend • I increases when… • Business confidence rises, prompting firms to invest more for the future.
Factors that Shift the AD Curve • G increases when… • Government spending increases • NX increases when… • There is increased preference for domestically produced goods. • An increase in the money supply will cause AD to shift right • Interest rates are lower, so C and I rise. The currency weakens, so NX increases.
Effects of Key Changes on the Aggregate Demand Curve • Entire AD curve shifts rightward if: • a, IP, G, orNXincreases • Net taxes decrease • The money supply increases (b) Price Level AD2 AD1 Real GDP
Short Run Aggregate Supply Curve Starting at point A, an increase in output raises unit costs. Firms raise prices, and the overall price level rises. Starting at point A, a decrease in output lowers unit costs. Firms cut prices, and the overall price levelfalls. Price Level AS 130 B 100 A 80 C Real GDP ($ Trillions) 6 10 13.5
Shifts of the AS Curve • Figure in last slide assumed that a number of important variables remained unchanged • Unit costs sometimes change for reasons other than a change in output • In general, we distinguish between a movement along AS curve, and a shift of curve itself, as follows • When a change in real GDP causes the price level to change, we move along AS curve • When anything other than a change in real GDP causes price level to change, AS curve itself shifts • What can cause unit costs to change at any given level of output? • Changes in world oil prices • Changes in the weather • Technological change • Nominal wage, etc.
Movements Along the AS Curve • When a change in output causes price level to change, we move along economy’s AS curve • What happens in economy as we make such a move? • As we move upward along AS curve, we can represent what happens as follows
Movements Along the AS Curve Real GDP ↑ moves us rightward along the AS curve Real GDP ↓ moves us leftward along the AS curve (a) Price Level AS P3 P1 P2 Real GDP Q2 Q1 Q3
Short Run Aggregate Supply Curve • Tightness in the labor market. • Suppose that because of a big economic expansion, the economy is producing at an output level Y that is greater than YP. • This suggests that the economy is using more labor than it normally does. • To get people to work longer hours, you have to pay them more. • This increase in labor costs will shift the SRAS curve left, as profit per output falls when labor costs rise. • Expectations about inflation • If workers expect inflation to be higher in the future, they will demand higher wages in anticipation of this increase in the cost of living. • Higher wages reduce firm profit and shift SRAS left • Supply shocks to critical raw materials • Suppose a war broke out between the US and Iran. Oil prices would rise dramatically • Since oil is such a pervasive part of nearly everything we produce, production costs would rise significantly. • The SRAS curve would shift left as the return on production fell.
Shifts of the AS Curve Entire AS curve shifts upward if unit costs ↑ for any reason besides an increase in real GDP (b) AS2 Price Level AS1 Real GDP
Short Run Equilibrium P SRAS PH Surplus P* Shortage PL AD Y* Y
Long Run Aggregate Supply • In the long run, money is neutral • Any changes in the money supply will be met by a proportionate change in prices • Increasing the money supply will not affect the economy’s output in the long run. • Long run output is determined entirely by an economy’s productive capacity • Production Function: YP = A*F(K,L,H,N) • Only changes in real variables can affect potential output. • Price does not have any effect on YP • In the long run, all resources are being efficiently utilized such that unemployment equals the natural rate
Long Run Aggregate Supply LRAS P 2 1 YP = 140 Y