Download
1 / 7
70 likes | 235 Views
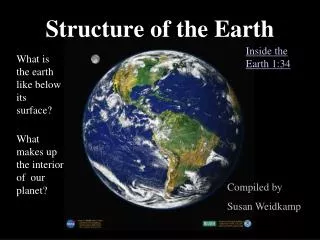
Structure of Earth. Story of Waves. Learning objectives: *written communication skills * data analysis skills *revision of content relating to seismic waves. Earthquakes produce P- and S-waves which pass through the Earth.

E N D
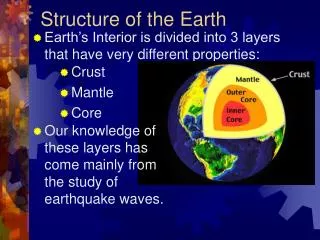
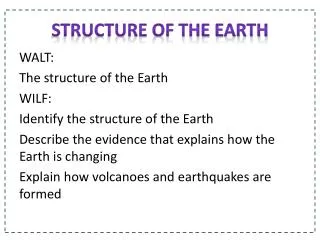
Structure of Earth Story of Waves Learning objectives: *written communication skills *data analysis skills *revision of content relating to seismic waves
Earthquakes produce P- and S-waves which pass through the Earth. Table 1 summarizes the properties of P-waves and S-waves.
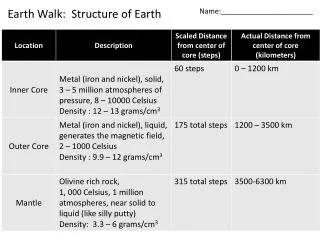
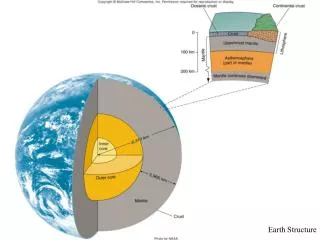
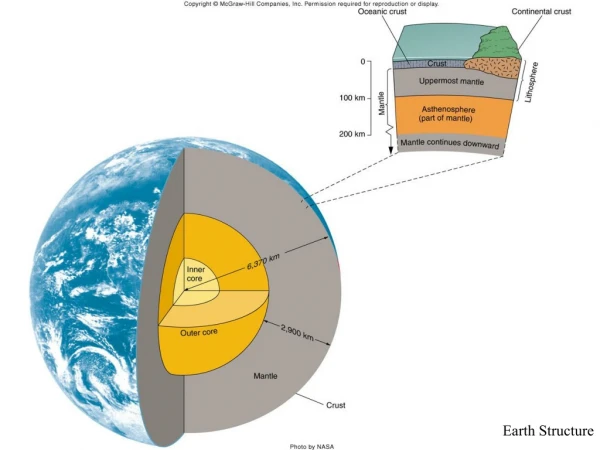
P-waves pass through both mantle and core, but are slowed and refracted at the mantle / coreboundary at a depth of 2900 km. S-waves passing from the mantle to the core are absorbed because shear waves cannot be transmitted through liquids. This is evidence that the outer core does not behave like a solid substance. S-waves are not transmitted through the liquid outer core. This produces a 'shadow zone' on certain parts of the Earth's surface where S-waves are not recorded, and this is used as the main piece of evidence to deduce the size of the core. The core has a radius of 3470 km.
Questions Q 1. (a) Draw dashed lines across the graphto show where S-wave velocity changes suddenly. (b) Label each of the zones between the lines to show how S-wave velocity changes, for example write ‘wave velocity decreasing’. Q 2. (Answer in designated spot on your paper in complete sentences) Why does S-wave velocity drop to zero at a depth of 2900 km? Q 3. (Answer in designated spot on your paper in complete sentences) (a) In what way is the P-wave velocity plot different from the S-wave velocity plot between the Earth’s surface and 2900 km depth? (b) In what way is the P-wave velocity plot similar to the S-wave velocity plot between the Earth’s surface and 2900 km depth? (c) Draw a dotted line on the graph for the area deeper than 2900 km to show where P-wave velocity changes (d) Label each of the zones from 2900 km to 6400 km to show how P-wave velocity changes, for example write ‘wave velocity decreasing suddenly’ or ‘wave velocity increasing gradually’. Q 4. Use the information from the graph and your answers to questions 1–3 above to mark and label on the graph: (1) the crust (2) the mantle (3) the outer core (4) the inner core Q 5. (Answer in designated spot on your paper in complete sentences) Summarize the properties of the different layers labeled 1-4 in the diagram below. The first one has been done for you. (On this diagram the crust is shown thicker than it really is, so that it can be seen.) (1) ‘P- and S-waves pass through the crust, so it is solid.’
Q1 answer: (a) Lines drawn at a little more than 0 km, at 2900 km and at about 5100 km. (b) In the zone between 0 km and 2900 km wave velocity is increasing. In the zone between 2900 km and 5100 km the wave velocity is zero
Q4. Use the information from the graph and your answers to questions 1–3 above to mark and label on the graph: (1) the crust (2) the mantle (3) the outer core (4) the inner core Use the properties information to label the graph.