Download
1 / 20
200 likes | 314 Views
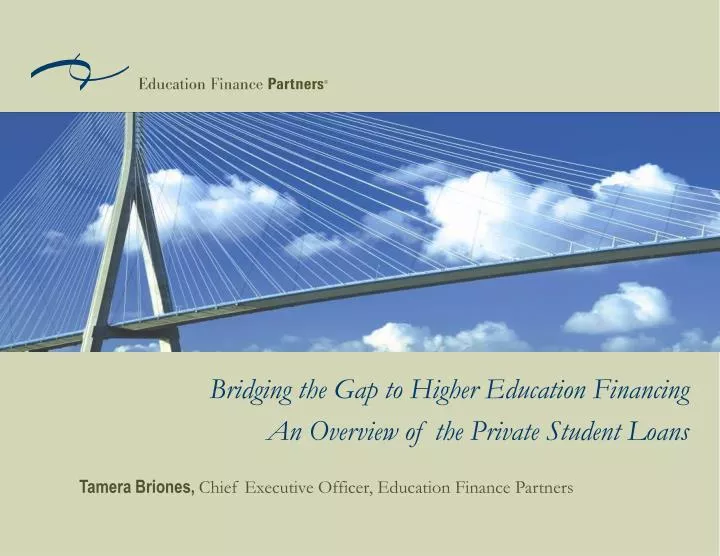
Bridging the Gap to Higher Education Financing An Overview of the Private Student Loans. Tamera Briones, Chief Executive Officer, Education Finance Partners. Student Loan Landscape. Market Dynamics. Tuition rose 59% in the past decade Family income rose 2%

E N D
Bridging the Gap to Higher Education Financing An Overview of the Private Student Loans Tamera Briones, Chief Executive Officer, Education Finance Partners
Market Dynamics • Tuition rose 59% in the past decade • Family income rose 2% • Federal loan limits remain stagnant • Grants and scholarships are not keeping pace with inflation Source: The College Board, 2005
Market Overview AY 2005 - 2006 Total Financial Aid Market Size: $152 Billion Student Loans Market Size: $86 Billion Private Loans 19% Federal (FDLP) 17% $16.3 B Other Loans 3% $2.3 B $14.8 B $86 B Student Loans 56% Student Loan Composition Grants & Credits 44% $66 B Federal (FFELP) 61% $52.5 B Other Student Loans = Federal Perkins Program ($1.14 B), State Sponsored Loans ($1 B), and other Federal Loans ($157 MM) “FDLP” indicates loans originated through the Ford Direct Loan Program “FFELP” indicates loans originated through the Federal Family Education Loan Program Source: The College Board – Trends in Student Aid 2006
The Funding Gap Total Cost of Education Versus Federal Loan Limits(2005/06 Academic Year) $105,000 $94,843 $85,000 $65,000 $58,264 $71,843 $45,000 $35,264 $25,000 Federal Loan Limits (Subsidized & Unsubsidized) $23,000 - 3rd - 5th Years - 2nd Year - 1st Year Cumulative Loan Limit Public Four-Year Private Four-Year Notes: Assumes average student enrollment of 4.75 academic years for public and 4.25 years for private. Estimates are for in-state resident students and include tuition, room and board, books and supplies, transportation costs, and other expenses. Excludes annual grants and scholarships, estimated at $3300 per student for public and $9600 for private. Source: The College Board.
Family Dynamics • America does not save • Personal Savings Rate negative 0.5%1 • 74% aged 45-54 have a retirement plan in place2 • Of those, 57% have saved less than $50K2 • College Savings • 9% of adults saving for retirement are also saving for college2 • Home Equity • 75.9% own a home • $150,000 in home equity • Touch Choice between retirement or education • $1MM2 needed for retirement • 62% believe paying for their children’s college will significantly impact their retirement • US Dept. of Commerce, The Organization of Economic Cooperation and Development • “2006 Retirement Confidence Survey,” Employee Benefit Research Institute • “Undergraduate Students and Credit Cards,” Nellie Mae, May 2005
Evolving Financial Aid Landscape $ Amount (Billions) Federal Private Stafford subsidized & unsubsidized, PLUS and Grad PLUS.
Pricing for Risk The Key Difference Between Federal and Private Loans
Federal Lending Lender & School
Pricing for Risk Loan Amount $7,500 $7,500 Federal Private
Pricing for Risk Risk Amount Interest & Processing $7,500 $225 Federal Private
Price Equates to Risk Consumer Loans Mortgage (5/1 ARM)1 Mortgage (30 year fixed)1 Equity Line of Credit ($30,000)1 Car Loan (60 month, new car)1 Private Education Loan2 Credit Card (student class)1 Average Interest Rates 5.62% 5.80% 8.20% 6.95% 10.88% 18.24% • Bankrate.com 2/8/07 • Survey of top 6 private lenders 2/8/07
Undergraduates & Credit Cards • 76% have credit cards • 24% use credit cards for tuition • 56% graduate with four credit cards & an average total balance of $6,400
Federal Loan Aid Grants andScholarships 35% 25% 20% FundingGap 20% Employment andWork/Study The Gap Source: The College Board, 2005
Student Debt – Meet Frank • Frank Needs a $10,000 Private Loan • He Has: • Established Credit • Parents Willing to Co-Sign • 850 FICO Score • His Rate: 7.5% - No Fee • His Monthly Payment: $123.99 • Total Cost Over Life of Loan = $22,317.82 Based on an $8000 loan amount deferred for 54 months, interest rate never changes, paid off over 180 monthly payments.
Student Debt – Meet Sue • Sue Needs a $10,000 Private Loan • She Has: • Established Credit • No Co-Signer • Minor Flaws on Credit Report • 665 FICO Score • Her Rate: 11% + Fee of 2% • Her Monthly Payment: $173.32 • Total Cost Over Life of Loan = $31,197.54 Based on an $8000 loan amount deferred for 54 months, interest rate never changes, paid off over 180 monthly payments.
National FICO Score Distribution 9% 9% 9% 9% 9% 8% 8% 8% 7% 5% 5% 4% 3% 2% 2 % 2% 1% <500 500 520 540 560 580 600 620 640 660 680 700 720 740 760 780 >800
Student Loan Debt • 55% - Feel burdened by school debt • 76% - Loans mean attending the college of choice • 85% - The benefits are worth it