Download
1 / 1
10 likes | 125 Views
Explore the impact of local environments on DNA's dynamics and conformational properties. Discover more about DNA solutions' conductivity variations through ion atmospheres characterizations using LFDS. Unveil DNA's behavior when influenced by electrolyte concentration, counter-ions, and pH.

E N D
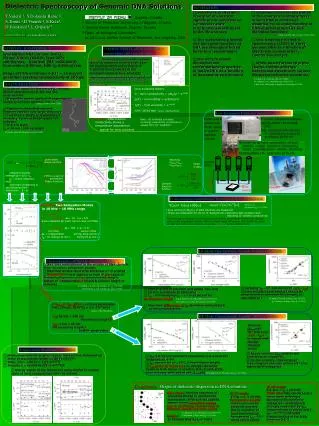
MOTIVATION Worldwide motivation: Transport of electrical signals in bio-materials on a molecular scale is of fundamental interest in the life sciences Our motivation: physical and biological functions of DNAare strongly affected by its local environment Our aim: to revealdynamical and conformational propertiesof native DNAas a function of its aqueous environment Experimental characterization of the counter-ion atmospheres around DNA in solution is essential for an understanding of DNA physical properties and biological functions Low frequency dielectric spectroscopy (LFDS) to study genomic DNAas a function of electrolyte concentration, counter-ion and pH LFDS: powerful tool to probe charge entities and their backgroundstructure in various bio-macromolecular structures ∞ Dielectric Spectroscopy ofGenomic DNA Solutions • T.Vuletić ¹, S.Dolanski Babić², S.Tomić ¹,D.Vurnek ¹, S.Krča³, D.Ivanković³, L.Griparić4 • tvuletic@ifs.hr ; www.ifs.hr/real_science ¹ , Zagreb, Croatia ² School of Medicine, University of Zagreb, Croatia ³ Institut Ruđer Bošković, Zagreb, Croatia 4 Dept. of Biological Chemistry, UCLA David Geffen School of Medicine, Los Angeles, USA R.Das et al.,Phys.Rev.Lett.90, 188103 (2003) SAMPLES & MATERIALS CONDUCTIVITY of DNA-solution vs. temperature and concentration Lyophillized DNA: salmon testes, Sigma-Aldrich (D1626, Type III); calf thymus, Rockland (MB –102-0100)Pure water: MilliPore, Milli-Q, 0.056 mS/cmRange of DNA solutions: 0.011 – 18 mg/mLquantified spectrophotometrically at 260 nm RESULT: Conductivity follows the power law with exponent smaller than 1 for both salmon-DNA and calf-DNA percolation character ofthe conduction path in DNA solutionsNote: measured conductivity (gray line) of DNA solution was subtracted for 1.5 mS/cm - the conductivity of pure water when measured in our chamber. chamber Pt steel casing N.Nandi et al., Chem.Rev.100, 2013 (2000) M. Sakamoto et al., Biopolymers 18, 2769 (1979) S.Bone et al., Biochymica et Biophysica Acta 1306, 93 (1996) DNA IN SOLUTION Low-frequency Dielectric Spectroscopy ionic solutions theory: Coulomb repulsion between PO4- groups, DNA is stretched outto the rod-like conformation Worm-like model: chain of N segments of length a;Contour length L = N · a Rigid over short distance and becomes flexibleover largedistances Persistance length Lp determines a boundarybetween the two types of behavior in 0.1 M NaCl; Lp= 50 nm : 150 bp length Precision impedance analyzer Agilent 4294A: 40 Hz-100 MHz C-G, capacitance & real part of conductance measured amplitude 20-50 mV Temperature control unit Temp. range: 0° to 60°C Stability: ±10 mK s – ionic conductivity = mNAer ~ eDH/RT m(T) – ion mobility = e/6pRh(T) Kratky and Porod (1949) Kuhn h(T) – H2O viscosity ~ e-DH/RT DH=-18 kJ/mol (Source: CRC Handbook) Chamber for complex conductivity of liquid samples – water solutions, conductivity range: 1.5-2000mS/cm; volume: 50-200 mL Reproducibility 1%, Long term (2 h) 2% RESULT: DNA solution conductivity shows a temperature dependence typical for ionic solutions Note: DH, enthalpy is related to energy required for a molecule to escape from its “neighbors” 200 nm M. Daune, Molecular Biophysics (Oxford, 2003) Agilent BNCs Resulting (GDNA-GNaCl, CDNA-CNaCl) generalized Debye function Note: C=B/w Pt relaxation process strength = (0) - ∞ 0 – central relaxation time symmetric broadening of the relaxation time distribution 1 - Complex dielectric function FITS to a sum of two generalized Debye functions From complex conductance to complex dielectric function e(w)= e’(w)-ie’’(w) Y(w)= G(w)+iB(w) • G(w) and C(w)=B(w)/w of DNA solutions are measured • These are subtracted for (G, C) of background (reference) NaCl solution with • matching (1-100kHz) conductivity Results: Two Relaxation Modes in 10 kHz – 10 MHz range This procedure enables to eliminate the electrode polarization effects, as well as other stray impedance effects. That is, since these influences are nearly the same in DNA and reference solutions, they are reduced by the subtraction. HF mode:De 10, 1-a 0.8 Same features for both salmon and calf DNA B.Saif et al., Biopolymers 31, 1171 (1991) LF mode:De 100, 1-a 0.8 calf DNAsalmon DNA De: c-independent strong drop at low c t0: no change at low c levels off at low c LF Mode Characteristic Length: Persistence Length Electro-kinetics of Electrical Double Layer Na+ ions redistributed in the vicinity of DNA chain in order to screenphosphate groups Electrical double layer with thickness k-1 is created Suggestion: Under applied ac field two types of dielectric dispersion two characteristic length scales: k-1- Debye-Hückel length & contour length of molecule ? S.S.Dukhin et al, Adv.Coll. Interface Sci. 13, 153 (1980) R.W.O’Brian, J. Coll. Interface Sci 113, 81 (1986). Certainly tLF~ L2 and we found De/c ~ LLF2 Both relaxation parameters should be proportional to characteristic length, L2according to : ? Similar effect of inherent and added Na+ ions All ions contribute to screening LLF~ I-1/2 implying LLF~k-1as expected for persistence length Important difference in Lp of salmon and calf DNA at low concentration ? ? ? ? M.Mandel, Ann.NY Acad.Sci. 303, 74 (1977) G.S.Manning, Biophys.Chem. 9, 65 (1978) P.G.de Gennes et al.,J.Phys.(Paris), 37, 1461 (1976) M.N. Spiteri et al., Phys.Rev.Lett.77, 5218 (1996) LHF,LF= (tHF.LFD)1/2 , t from experimentsD=kBT/6phR,D(25°C) = 1.5 ·10-9 m2/s (Source: CRC Handbook) LLF:60 nm – 750 nm Persistence length? HF Mode Characteristic Length: DNA mesh size LHF: 4 nm – 45 nmDH screening length? or DNA mesh size? Inherent (INaCl=0) Na+ ions only:De/c ~ LHF2in accord withMandel-Manning model Temperature dependent relaxation Mode characteristic lengthsappear temperature independent Since characteristic length L=(D(T)·t(T))1/2 Thus, t(T)~ 1/D(T) ~ 1/(T·e-DH/RT) Therefore, t should be FIT to eDH/RT/T Added salt ions (INaCl≠0) do not contribute to relaxation. On the contrary, they increase screening and strongly reduce Na+ ions active in HF relaxation LHF is DNA concentration dependent, but added salt independent LHFcan not be k-1 ~ I-1/2 , Debye-Hückel length LHFgiven by mesh size, ie. average distance between DNA chains in solution (this length scale does not vary with added salt, INaCl≠0) Energy scales of the modesarequite similar to energy scale of ionic conductivity:DH= -18 kJ/mol Conclusion - Origin of dielectric dispersion in DNA solutions 3) HF mode: 0.1 kHz < f0 < 15 MHz Mesh size: DNA chains form a loose mesh defining a characteristic length for relaxation– attribution is strongly supported by LHF independence of added salt I. LHF~ c1/2-1/3, indicates dimensionality of the web between 2 & 3. DH= -20±2 kJ/mol DNA chain:Random sequence of segments placed incounter-ion atmosphere. With ac field applied, appear broad relaxation modes due to oscillating counter-ions at different length and time scales Modes: 1) Contour length; f0 < 1 kHz 2) LF mode: 1 kHz < f0 < 70 kHz Persistence length: distance bound by potential barriers due to variation of local conformation As expected Lp~ I-1/2 when salt is added - Na+, Cl- - - - - - L - k-1 - M. Sakamoto et al., Biopolymers 18, 2769 (1979) S.Takashima, J.Phys.Chem.70, 1372 (1966) Lp - LHF M.N. Spiteri et al., Phys.Rev.Lett.77, 5218 (1996)