Download
1 / 38
380 likes | 512 Views
Ch.11 Risk and Uncertainty Management Dr. Ayham Jaaron. Rather than passively accepting risks, many managers see it as their duty to take actions to reduce them Indeed, many would go further than this and say that their role is also to identify opportunities.

E N D
Ch.11 Risk and Uncertainty Management Dr. Ayham Jaaron
Rather than passively accepting risks, many managers see it as their duty to take actions to reduce them • Indeed, many would go further than this and say that their role is also to identify opportunities
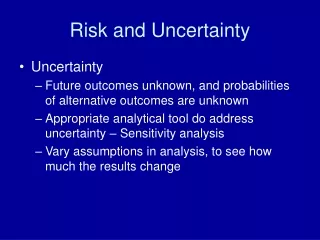
Overview of SWOT analysis to identify risks and remidies • Four types of strategies: • Strengths-Opportunities (SO) • Weaknesses-Opportunities (WO) • Strengths-Threats (ST) • Weaknesses-Threats (WT)
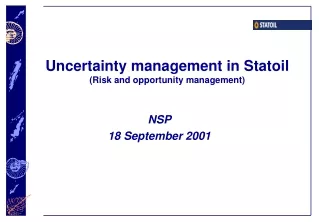
SO Strategies StrengthsWeaknessesOpportunities ThreatsSWOT Use a firm’sinternal strengthsto take advantageof external opportunities SOStrategies
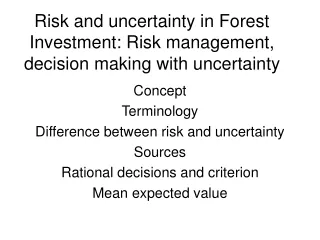
WO Strategies StrengthsWeaknessesOpportunities ThreatsSWOT Improving internalweaknesses bytaking advantageof externalopportunities WOStrategies
ST Strategies StrengthsWeaknessesOpportunities ThreatsSWOT Use a firm’s strengthsto avoid orreduce the impactof externalthreats STStrategies
WT Strategies StrengthsWeaknessesOpportunities ThreatsSWOT Defensive tacticsaimed at reducinginternal weaknesses & avoidingenvironmentalthreats WTStrategies
Excess working capital (strength) + 20% annual growth in the cell phone industry (opportunity) = Acquire Cellfone, Inc. Insufficient capacity (weakness) + Exit of two major foreign competitors from the industry (opportunity) = Pursue horizontal integration by buying competitor's facilities Strong R&D (strength) + Decreasing numbers of young adults (threat) = Develop new products for older adults Poor employee morale (weakness) + = Develop a new employee benefits package Strong union activity (threat) Matching Key Factors to reduce threats or capture opportunities Resultant Strategy Key Internal Factor Key External Factor
Using brainstorming to create actions to improve the preferred policy • Creative thinking can be used by the management team to produce actions that will potentially reduce the risk and identify opportunities. Brainstorming is one technique that can enhance creativity • Brainstorming is usually regarded as a method to be used with groups of people. Although it can be employed by individuals, the benefit of involving a group is that one person’s ideas can help to stimulate even more ideas by other group members.
Brainstorming rules..... • Do not criticize ideas • Encourage participants to put forward any idea that they can think of • Aim to generate large quantities of ideas • Encourage people to combine or modify ideas that have already been put forward
SPACE Matrix Strategic Position & Action Evaluation Matrix • Aggressive: focus on internal strengths to gain opportunities • Conservative: carry on using the same strategy, not to change the set of actions already used. • Defensive: rectify internal weaknesses by using external opportunities or threats. • Competitive: use competitive strategies such as backward, forward and horizontal integration.
SPACE Matrix Two Internal Dimensions • Financial Strength (FS) • Competitive Advantage (CA)
SPACE Matrix Two External Dimensions • Environmental Stability (ES) • Industry Strength (IS)
Internal Strategic Position External Strategic Position Financial Strength (FS) Return on investment Liquidity Working capital Cash flow Environmental Stability (ES) Technological changes Rate of inflation Demand variability Price range of competing products Barriers to entry Competitive pressure Price elasticity of demandEase of exit from market SPACE Factors
Internal Strategic Position External Strategic Position Competitive Advantage CA Market share Product quality Product life cycle Customer loyalty Capacity utilization Control over suppliers & distributors Industry Strength (IS) Growth potential Profit potential Technological know-how SPACE Factors
Steps to Developing a SPACE Matrix • Select a set of variables to define FS, CA, ES, & IS • Assign a numerical value: • From +1 to +6 to each FS & IS dimension • From -1 to -6 to each ES & CA dimension • Compute an average score for each FS, CA, ES, & IS
Steps to Developing a SPACE Matrix • Plot the average score on the appropriate axis • Add the two scores on the x-axis and plot the point. Add the two scores on the y-axis and plot the point. Plot the intersection of the new xy point • Draw a directional vector from the origin through the new intersection point.
SPACE Matrix FS Conservative Aggressive +6 +5 +4 +3 +2 +1 CA IS -6 -5 -4 -3 -2 -1 +1 +2 +3 +4 +5 +6 -1 -2 -3 -4 Defensive -5 Competitive -6 ES
BCG Matrix Boston Consulting Group Matrix • Enhances multi-divisional firm in formulating strategies • Autonomous divisions = business portfolio • Divisions may compete in different industries • Focus on market-share position & industry growth rate
BCG Matrix Relative Market Share Position • Ratio of a division’s own market share in an industry to the market share held by the largest rival firm in that industry
Stars II Question Marks I Cash Cows III Dogs IV BCG Matrix Relative Market Share Position High 1.0 Medium .50 Low 0.0 Industry Sales Growth Rate High +20 Medium 0 Low -20
BCG Matrix Question Marks • Low relative market share – they compete in high-growth industry • Cash needs are high • Cash generation is low • Decision whether to strengthen (intensive strategies) or divest.
BCG Matrix Stars • High relative market share and high growth rate • Best long-run opportunities for growth & profitability • Substantial investment to maintain or strengthen dominant position • Integration strategies, intensive strategies, joint ventures.
BCG Matrix Cash Cows • High relative market share, competes in low-growth industry • Generate cash in excess of their needs • Milked for other purposes • Maintain strong position as long as possible • Product development, concentric diversification • If weakens—retrenchment or divestiture
BCG Matrix Dogs • Low relative market share & compete in slow or no market growth • Weak internal & external position • Liquidation, divestiture, retrenchment
Strategy-Formulation Analytical Framework Quantitative StrategicPlanning Matrix(QSPM) The Decision Stage
QSPM Quantitative Strategic Planning Matrix • Technique designed to determine the relative attractiveness of feasible alternative actions
Key External Factors Economy Political/Legal/Governmental Social/Cultural/Demographic/Environmental Technological Competitive Weight Strategy 1 Strategy 2 Strategy 3 Key Internal Factors Management Marketing Finance/Accounting Production/Operations Research and Development Computer Information Systems Strategic Alternatives QSPM
Steps to Develop a QSPM • Make a list of the firm’s key external opportunities/threats and internal strengths/weaknesses in the left column • Assign weights to each key external and internal factor • Examine the Stage 2 (matching) matrices, and identify alternative strategies that the organization should consider implementing
Steps to Develop a QSPM • Determine the Attractiveness Scores (1=not attractive, 2= somewhat attractive, 3= reasonably attractive, highly attractive). • Compare the Total Attractiveness Scores • Compute the Sum Total Attractiveness Score
QSPM Advantages • Sets of strategies considered simultaneously or sequentially • Integration of pertinent external & internal factors in the decision making process