Download
1 / 35
350 likes | 460 Views
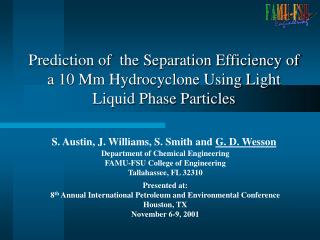
This study focuses on the prediction of separation efficiency for a 10 mm hydrocyclone using light liquid phase particles. With oil production necessitating effective water treatment, maintaining an oil concentration below 30 ppm is critical for environmental compliance. This presentation covers hydrocyclone principles, performance measurements, and experimental results, highlighting the effects of parameters such as particle size and feed pressure. Future work will explore drop breakup and methods to enhance separation efficiency further.

E N D
Prediction of the Separation Efficiency of a 10 Mm Hydrocyclone Using Light Liquid Phase Particles S. Austin, J. Williams, S. Smith and G. D. Wesson Department of Chemical Engineering FAMU-FSU College of Engineering Tallahassee, FL 32310 Presented at: 8th Annual International Petroleum and Environmental Conference Houston, TX November 6-9, 2001
Presentation Outline • Motivation • Hydrocyclone principles • Particle separation theory • Hydrocyclone performance measurements • Separation experiments • Results • Conclusions and future work • Acknowledgements
Motivation • Oil production requires water treatment. • Required offshore constraint < 30 ppm of oil in water to environment • Interest in down-hole separation
Hydrocyclone Operation Principles • Tangential feed entry • Creation of core vortex • High local accelerations • Complex internal flows • No moving parts
Liquid Particle -Fluid Interaction • Liquid particles remain spherical • Particle diameter < 50 microns • Rep <0.1 , i.e. creeping flow • Incompressible fluids
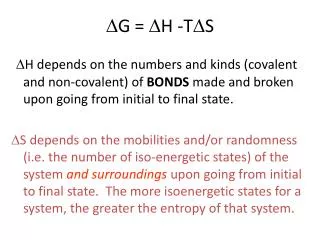
Liquid Particle -Fluid Interaction Stokes’ law
Terminal velocity Separation is a function of: Density difference Particle size Continuous phase viscosity Cyclone diameter Local accelerations in 10mm cyclone may approach 10,000 g Particle Motion
Measuring the Performance • Many ways to measure hydrocyclone performance • Due to different applications • “Traditional” separation measurement: QOCOfO(l) QFCF fF(l) QUCU fU(l)
Separation Efficiency • Efficiency based on total fraction of concentration reduction or: • Equivalent to “traditional” efficiency measurement
Separation Theory • Grade underflow purity coefficient-separation efficiency for each particle size • Integrating over sizes yields overall separation efficiency
Grade Efficiency Curve • Continuous function of particles sizes • Hydrocyclone performance is size dependent and GEC varies with particles size • Graphically represented as curve that is usually ‘S’ shaped • “Overall” separation efficiency is a result of the integration of the product of the GPC and the feed distribution
Grade Efficiency Curve Wesson & Petty 1994
10mm Hydrocyclone 2.5 mm 2.5 mm 80 mm 10 mm 1 mm
Experimental Flow Loop hydrocyclone Stirrer Sample Cylinders tank pump
Flow Predictions • Feed pressure varied from 60 - 160 psig • Flow rates determined using stopwatch • Linear regression Qf = f(Po, Pu)
Determine optimum conditions which will give the best separation efficiency Compare concentration separation efficiency with traditional way of determining efficiency. Experiment
Soda Lime Borosilicate Glass glass bubbles and water : r = 0.1 g/cm3 c = 1 cp (Cannon-Fenske viscometer) lmean = 30 mm Model Dispersion
Results Conc vs. oil droplet sizes at 60 psi pressure drop
Results Conc vs. oil droplet sizes at 60 psi pressure drop
Results Grade Purity Function vs. Diameter – 4.85 lpm
Results Overall efficiency vs. Feed flow rate
Conclusions • Glass bubbles-water separation • Best overall efficiency for feed distribution occurs 4.8 lpm feed flow rate (DP=200 psi) • L50 = 10 mm
Vegetable oil dispersion in water: r = 0.1 g/cm3 (pycnometer) d = 50 cp (Cannon-Fenske viscometer) c = 1 cp (Cannon-Fenske viscometer) 30 dynes/cm (Pendant drop method) Model Dispersion
Results Conc vs. oil droplet sizes at 60 psi DP
Results Conc. vs oil droplet sizes at 160 DP
Concentration G-curves Grade Purity Coefficient vs. Oil droplet diameter at various flow rates L/min best GPC-curve “Drop Breakup”
Results The best “overall” efficiency?
Conclusions • Oil-Water separation • Best overall efficiency for feed distribution occurs 3.0 lpm feed flow rate (DP=60 psi) • Best GPC curve occurs at 3.7 lpm feed flow rate (DP=100 psi)
Continued Work • Investigate drop breakup • Investigate source of ‘fish hook” • Investigate use of back pressure to eliminate the air from the core vortex