Download

1 / 14
140 likes | 249 Views
QoS on Best-effort IP Networks. Les Cottrell – SLAC www.slac.stanford.edu/grp/scs/net/talk/qos-itu-apr01/

E N D
QoS on Best-effort IP Networks Les Cottrell – SLAC www.slac.stanford.edu/grp/scs/net/talk/qos-itu-apr01/ Presented at the Joint SG13/SG16 Workshop Panel Session: "Achieving Multimedia QOS over IP-Based Networks"part of the ITU-T SG13/SG16 Workshop on IP Networking and Mediacom 2004, Geneva, Switzerland, April 25-27, 2001 Partially funded by DOE/MICS Field Work Proposal on Internet End-to-end Performance Monitoring (IEPM), also supported by IUPAP
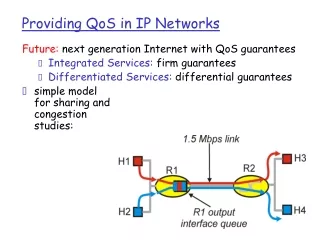
Overview • Measurement methodology • Delay • Loss • Jitter • Availability • Summary
PingER PingER • Measurements from • 32 monitors in 14 countries • Over 600 remote hosts • Over 72 countries • Over 3300 monitor-remote site pairs • Measurements go back to Jan-95 • Uses ubiquitous “ping” facility of TCP/IP • Countries monitored • Contain 78% of world population • 99% of online users of Internet
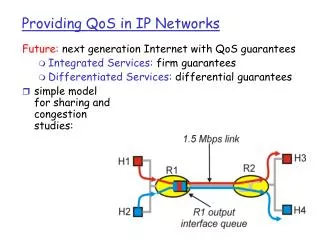
RTT from ESnet to Groups of Sites RTT ~ distance/(0.6*c) + hops * router delay Router delay = queuing + clocking in & out + processing ITU G.114 300 ms RTT limit for voice 20%/year
RTT Region to Region OK White 0-64ms Green 64-128ms Yellow 128-256ms NOT OK Pink 256-512ms Red > 512ms OK within regions, N. America OK with Europe, Japan
RTT from California to world Europe E. Coast Brazil E. Coast US W. Coast US 300ms RTT (ms) Europe & S. America 3*0.6c Longitude (degrees) 300ms Frequency Source = Palo Alto CA, W. Coast RTT (ms.)
Loss seen from US to groups of Sites 50% improvement / year ITU limit for loss
Loss to world from US Using year 2000, fraction of world’s population/country from www.nua.ie/surveys/how_many_online/
“Jitter” by time • Jitter = (1/n) * SUM i=2,n (abs(RTT(i) - RTT(i-1))) 225ms=Poor 125ms=Med 75ms=Good DTR/TIPHON-05001 V1.2.5 (1998-09)
SLAC-CERNJitter ITU/TIPHON delay jitter threshold (75 ms)
Availability – Outage Probabaility Surveyor probes randomly 2/second Measure time (Outage length) consecutive probes don’t get through http://www-iepm.slac.stanford.edu/monitoring/surveyor/outage.html
More Information • This talk: • www.slac.stanford.edu/grp/scs/net/talk/qos-itu-apr01/ • IEPM/PingER home site • www-iepm.slac.stanford.edu/