Queueing Theory Models
Queueing Theory Models . Training Presentation By: Seth Randall. Topics. What is Queueing Theory? How can your company benefit from it? How to use Queueing Systems and Models? Examples & Exercises How can I learn more?. What is Queueing Theory?. The study of waiting in lines (Queues)

Queueing Theory Models
E N D
Presentation Transcript
Queueing Theory Models Training Presentation By: Seth Randall
Topics • What is Queueing Theory? • How can your company benefit from it? • How to use Queueing Systems and Models? • Examples & Exercises • How can I learn more?
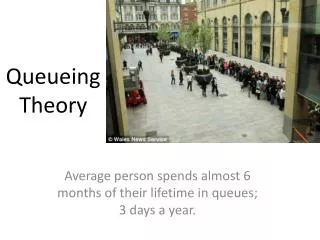
What is Queueing Theory? • The study of waiting in lines (Queues) • Uses mathematical models to describe the flow of objects through systems
Can queuing models help my firm? • Increase customer satisfaction • Optimal service capacity and utilization levels • Greater Productivity • Cost effective decisions
Examples • How many workers should I employ? • Which equipment should we purchase? • How efficient do my workers need to be? • What is the probability of exceeding capacity during peak times?
Brainstorm • Can you identify areas in your firm where queues exist? • What are the major problems and costs associated with these queues?
Customer Arrivals • Finite Population : Limited Size Customer Pool • Infinite Population: Additions and Subtractions do not affect system probabilities.
Customer Arrivals • Arrival Rate λ = mean arrivals per time period • Constant: e.g. 1 per minute • Variable: random arrival
2 ways to understand arrivals • Time between arrivals • Exponential Distribution f(t) = λe- λt • Number of arrivals per unit of time (T) • Poisson Distribution
Time between arrivals f(t) = λe- λt f(t) = The probability that the next arrival will come in (t) minutes or more
Number of arrivals per unit of time (T) = The probability of exactly (n) arrivals during a time period (T)
Can arrival rates be controlled? • Price adjustments • Sales • Posting business hours • Other?
Other Elements of Arrivals • Size of Arrivals • Single Vs. Batch • Degree of patience • Patient: Customers will stay in line • Impatient: Customers will leave • Balking – arrive, view line, leave • Reneging – Arrive, join queue, then leave
Suggestions to Encourage Patience • Segment customers • Train servers to be friendly • Inform customers of what to expect • Try to divert customer’s attention • Encourage customers to come during slack periods
Types of Queues • 3 Factors • Length • Number of lines • Single Vs. Multiple • Queue Discipline
Length • Infinite Potential • Length is not limited by any restrictions • Limited Capacity • Length is limited by space or legal restriction
Line Structures • Single Channel, Single Phase • Single Channel, Multiphase • Multichannel, single phase • Multichannel, multiphase • Mixed
Queue Discipline • How to determine the order of service • First Come First Serve (FCFS) • Reservations • Emergencies • Priority Customers • Processing Time • Other?
Two Types of Customer Exit • Customer does not likely return • Customer returns to the source population
Notations for Queueing Concepts λ = Arrival Rate µ = Service Rate 1/µ = Average Service Time 1/λ = Average time between arrivals р = Utilization rate: ratio of arrival rate to service rate ( ) Lq = Average number waiting in line Ls = Average number in system Wq = Average time waiting in line Ws = Average total time in system n = number of units in system S = number of identical service channels Pn = Probability of exactly n units in system Pw = Probability of waiting in line
Service Time Distribution • Service Rate • Capacity of the server • Measured in units served per time period (µ)
Exercise • Should we upgrade the copy machine? • Our current copy machine can serve 25 employees per hour (µ) • The new copy machine would be able to serve 30 employees per hour (µ) • On average, 20 employees try to use the copy machine each hour (λ ) • Labor is valued at $8.00 per hour per worker
Exercise Current Copy Machine: = 4 people in the system hours waiting in the system
Exercise Upgraded Copy Machine: people in system hours
Current Machine: • Average number of workers in system = 4 • Average time spent in system = 0.2 hours per worker • Cost of waiting = 4 * 0.2 * $8.00 = $6.40 per hour New Machine: • Average number of workers in system = 2 • Average time spent in system = 0.1 hours per worker • Cost of waiting = 2 * 0.1 * $8.00 = $1.60 per hour Savings from upgrade = $4.80 per hour
Conclusion and Takeaways • Queueing Theory uses mathematical models to observe the flow of objects through systems • Each model depends on the characteristics of the queue • Using these models can help managers make better decisions for their firm.
How Can I Learn More? • Fundamentals of Queueing Theory • Donald Gross, John F. Shortle, James M. Thompson, and Carl M. Harris • Applications of Queueing Theory • G. F. Newell • Stochastic Models in Queueing Theory • Jyotiprasad Medhi • Operations and Supply Management: The Core • F. Robert Jacobs and Richard B. Chase
References • Jacobs, F. Robert, and Richard B. Chase. “Chapter 5." Operations and Supply Management The Core. 2nd Edition. New York: McGraw-Hill/Irwin, 2010. 100-131. Print. • Newell, Gordon Frank. Applications of Queueuing Theory. 2nd Edition. London: Chapman and Hall, 1982.