Download
1 / 77
770 likes | 919 Views
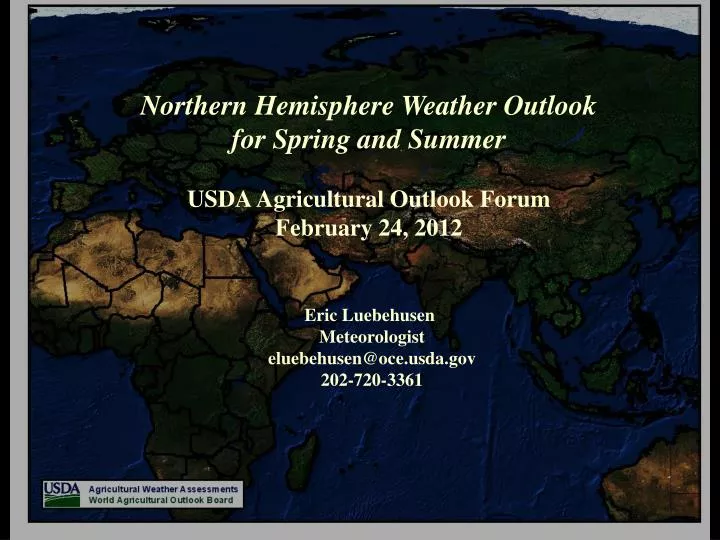
Northern Hemisphere Weather Outlook for Spring and Summer USDA Agricultural Outlook Forum February 24, 2012. Eric Luebehusen Meteorologist eluebehusen@oce.usda.gov 202-720-3361 . A Few Quick Notes about Forecasting….

E N D
Northern Hemisphere Weather Outlook for Spring and Summer USDA Agricultural Outlook Forum February 24, 2012 Eric Luebehusen Meteorologist eluebehusen@oce.usda.gov 202-720-3361
The primary difference among forecasters and their respective forecasts is the amount of time it takes people to figure out they were wrong. –Yours Truly ?
Case In Point: On December 29, 2000 (yes, I remember)… In line with NWS and TV Meteorologists, I strongly advised family and friends of an impending 12-18” snowstorm for much of central MD…
? "We see no serious broad spillover to banks or thrift institutions from the problems in the subprime market." – Ben Bernanke, May 2007 Dow Jones
"We see no serious broad spillover to banks or thrift institutions from the problems in the subprime market." – Ben Bernanke, May 2007 Dow Jones
Of the 12 ESPN “Experts”, all failed to pick the eventual Super Bowl Winner, and none had the eventual winner even making it to the game (only 1 picked the Giants make the playoffs).
Now that I have set the stage… let’s give it a spin!
Primary Tools for Long Range Forecasts · Current: “Where do we stand heading into the spring?”
Primary Tools for Long Range Forecasts · Current: “Where do we stand heading into the spring?” · Climate Indices: El Nino, La Nina, North Atlantic Oscillation (NAO), etc… NAO Timeseries
Primary Tools for Long Range Forecasts · Current: “Where do we stand heading into the spring?” · Climate Indices: El Nino, La Nina, North Atlantic Oscillation (NAO), etc… · Models: GFS, Ensemble Means, CFS, etc…
Primary Tools for Long Range Forecasts · Current: “Where do we stand heading into the spring?” · Climate Indices: El Nino, La Nina, North Atlantic Oscillation (NAO), etc… · Models: GFS, Ensemble Means, CFS, etc… · Agency: Experts from NWS-CPC, IRI, UK Met Office, etc…
Primary Tools for Long Range Forecasts · Current: “Where do we stand heading into the spring?”
Fall Drought led to poor crop establishment in eastern Europe and Ukraine…
In contrast, above-normal rainfall benefited wheat in nrn Africa and Russia
During the winter, conditions vastly improved over Ukraine and the Balkans, but a good spring will be vital for winter grains and oilseeds
Conversely, Spain (and to a lesser extent Morocco) has slipped rapidly into drought, raising concerns for their wheat and barley; Spain, however, accounts for only ~5% of EU Wheat
The bigger concern in Europe will be the amount of winterkill in northern wheat and rapeseed areas…
The threshold for burnback/winterkill is ~ -18°C (0°F); Min temps are overlaid on wheat areas, and lack of snow cover in key wheat and rapeseed areas of northeast Germany and northwest Poland increasing the risk for winterkill
Also France’s durum wheat (threshold closer to -10°C (14°F).
We won’t know the full impact of the freeze until crops emerge in the spring
Farther east, China’s primary winter wheat benefited from favorable autumn pcp
China’s rapeseed – which like wheat is irrigated – experienced some dryness (but favorably wet leading up to planting)
A favorable end to the monsoon was likewise beneficial for India’s wheat and rapeseed, which is also irrigated…
Much of Asia’s wheat and rapeseed is heavily irrigated, due in part to the strong seasonality of the pcp
In fact, winter is a very dry time of year over much of central and eastern Asia, so small departures can yield alarming percent of normal values.
Winter crop prospects are mostly favorable, but localized autumn drought (Ukraine, eastern EU), a cold snap (northern EU), and developing drought (Spain) reveal potential yield-impacting issues
In South & East Asia, winter crop prospects are currently favorable with no major underlying issues
Primary Tools for Long Range Forecasts · Currently: “Where do we stand heading into the spring?” · Climate Indices: El Nino, La Nina, North Atlantic Oscillation (NAO), etc… NAO Timeseries
La Niña/El Niño Impacts La Niña weather impacts are greatest the closer you are to the actual phenomenon
Cool Cool Warm Cool Cool The spring La Niña temperature correlation is weak, but toward the cool side Data provided by the NOAA/ESRL Physical Sciences Division, Boulder Colorado from their Web site at http://www.esrl.noaa.gov/psd
Cool Warm Cool Cool With a weakening La Niña, the summer temperature correlation is less likely to verify; nevertheless, the overall idea is still the same. Data provided by the NOAA/ESRL Physical Sciences Division, Boulder Colorado from their Web site at http://www.esrl.noaa.gov/psd
Dry Wet Wet Dry The weak EU/FSU La Niña precip correlation shows a gradual eastward shift of the initial Iberian wetness and northern Europe dryness. Meanwhile, the signal in China and India shift north and weaken with time (Spring Pcp Relationship Depicted) Wet Wet Data provided by the NOAA/ESRL Physical Sciences Division, Boulder Colorado from their Web site at http://www.esrl.noaa.gov/psd
Dry Wet Dry Dry Wet Wet The weak EU/FSU La Niña precip correlation shows a gradual eastward shift of the initial Iberian wetness and northern Europe dryness. Meanwhile, the signal in China and India shift north and weaken with time (Summer Pcp Relationship Depicted) Data provided by the NOAA/ESRL Physical Sciences Division, Boulder Colorado from their Web site at http://www.esrl.noaa.gov/psd
In short, La Niña supports a cooler- and drier-than-normal spring in nrn India and much of China Dry Dry Wet Cool Warm
If La Niña holds on into the summer, it would suggest cooler summer weather and some enhanced nrn rainfall in Asia Dry Dry Wet Warm Warm Cool
While La Niña does play a small role in Europe, there’s a much closer, larger-impacting phenomenon to assess… Wet Dry Dry Cool Warm Cool
While La Niña does play a small role in Europe, there’s a much closer, larger-impacting phenomenon to assess…
Iceland Low L COLD COLD H Azores High WARM The NAO (North Atlantic Oscillation) is, in short, a means of measuring the flow aloft over the northern Atlantic
+ L Iceland Low COLD COLD H WARM Azores High During a “Positive” Phase, one or both of the main drivers is stronger than normal, enhancing the flow (I call it the “North Atlantic Shop Vac”)
- H Iceland “Blocking High” COLD COLD L WARM Azores “Low” During a “Negative” Phase, one or both of the main drivers is weaker or reversed, disrupting the flow and buckling the jet stream
- H Iceland “Blocking High” WARM L COLD COLD WARM Azores “Low” During a “Negative” Phase, one or both of the main drivers is weaker or reversed, disrupting the flow and buckling the jet stream
Fast Flow + The NAO operates on many scales; A decadal signal is evident (using 3-month avg: Jan-Mar)… - Blocking High Source: NOAA/NCEP Climate Prediction Center
Fast Flow + But embedded within this is considerable year-to-year variability… - Blocking High Source: NOAA/NCEP Climate Prediction Center
Monthly NAO Index The monthly-average NAO was negative in 2009 & 2010, but reverted back to positive for much of 2011 Fast Flow Blocking High 2009 2010 2011 Data from NWS, Climate Prediction Center
Monthly NAO Index Embedded within this are notable daily/weekly fluctuations… Fast Flow Blocking High 2009 2010 2011 Data from NWS, Climate Prediction Center