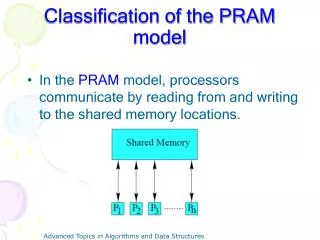
Download
1 / 14
140 likes | 157 Views
Explore the use of microaggregation and PRAM with protected data tabulation, focusing on methods, results, and conclusions. Investigate the effectiveness of SDC techniques in safeguarding categorical data while addressing issues of information loss and data protection reliability.

E N D
The use of protected microdata in tabulation: case of SDC-methods microaggregation and PRAM Researcher Janika Konnu Manchester, United Kingdom 17-19 December 2007
Outline • Data • SDC-methods • Results • Conclusions • Forthcoming research Janika Konnu
Data used in the study • Data of teachers was originally collected for administrative purposes. • Only high schools teachers (N=7798) were included in our study. • Data included information about • teachers: age, gender, position, etc. • the schools those teachers taught in: the location of the school, number of students, etc. Janika Konnu
First data is divided into groups of k observations and the group averages are released instead of original values of variable. MDAV-algorithm was used in grouping: algorithm finds the average observation with respect to the values and forms groups by using the distance from this average observation. Grouping the data is the crucial point for this method: when the most similar observations are contained in the group, information loss will be minimised. In our study microaggregation was used for categorical data although it is intended for numerical data. SDC Methods: Microaggregation Janika Konnu
Method changes values of a variable according to probability matrix (Markov matrix) example: When PRAM is applied, data user must take the probability matrix into account in order to obtain correct results. In our study we were testing usefulness of PRAM when probability matrix is not used in analysis. SDC Methods: The Post RAndomization Method Janika Konnu
Empirical work: -Argus software • Software includes disclosure risk measurement and following methods: global recoding, local suppression, top and bottom coding, PRAM, numerical microaggregation, numerical rank swapping and Sullivan masking. • Software produces protected data if suppressions are allowed. • In our case, only SDC-methods PRAM and numerical microaggregation were studied. No suppressions were made, because we needed information on the difference between original and protected data. Janika Konnu
Results: Data protected by MicroaggregationGroup sizes used in protection are 2, 5, 8, 10 and 15 • Microaggregation does not have an effect on frequencies. • Unfortunately this implies that hardly any change occur in values. • Conclusion: microaggregation does not give strong enough protection when it comes to categorical data. Janika Konnu
Results: Data protected by PRAM (no bandwidth)Changing probabilities: 0.05, 0.10, 0.20, 0.30 and 0.40 • PRAM changes values of variables and that way data will be protected. • Unfortunately PRAM leads to problems when categories have big differences in the frequencies. The larger frequency keeps getting smaller and the other way around. Janika Konnu
Results: Data protected by PRAM (bandwidth is 2)Changing probabilities: 0.05, 0.10, 0.20, 0.30 and 0.40 • Restricting the change of values can not solve problem with difference in frequencies. • Our study shows that frequencies in categories next to the one with largest frequency still grow too fast. Janika Konnu
Results: Data protected by PRAM No bandwidth Bandwidth is 2 Janika Konnu
Conclusion: Microaggregation • Microaggregation perform well with numerical data, but its application for categorical data needs more research. • Data protected by microaggregation includes almost the same information as the original data. • Are we sure that microaggregation is able to protect categorical data properly? Janika Konnu
Conclusion: PRAM • PRAM seems to perform quite well when it comes to protecting data, but there are some issues to overcome. • PRAM can protect data with small changing probabilities, because it is based on uncertainty of identification. • In this case our concern is with information loss. Is the protected data useful without using probability matrix? Janika Konnu
Forthcoming research • Include more methods • rank swapping • noise adding • Include disclosure risk measures • Include more precise measurement for information loss Janika Konnu
Some preferences • Domingo-Ferrer, J., Torra, V. 2001. A Quantitative Comparison of Disclosure Control Methods for Microdata. In Confidentiality, Disclosure, and Data Access: Theory and Practical Applications for Statistical Agencies. Amsterdam: North-Holland. • Gouweleeuw, J., Kooiman, P., Willenborg, L., and de Wolf, P. 1998. Post Randomisation for Statistical Disclosure Control: Theory and Implementation. Journal of Official Statistics. Vol. 14, No.4, s. 463--478. • Group Crises. 2004. Research Reports: Microaggregation for Privacy Protection in Statistical Databases. In July 2005. <http://vneumann.etse.urv.es/publications/reports/>. Thank You! Janika Konnu