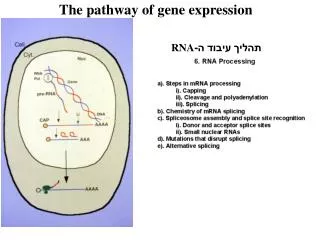
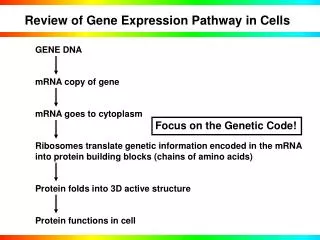
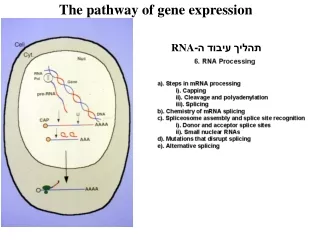
Pathway Database Pathway Comparison Expression Viewer Discovery.
The Pathway Comparison Viewer developed at Oregon State University provides an intuitive interface for analyzing metabolic and gene expression pathways across various plant species. Users can compare pathways, explore gene and enzyme functions, and zoom into chemical structures of metabolites. Evidence from homologous pathways, such as comparisons between Rice and Arabidopsis, enhances research accuracy. The OMICs Expression Viewer allows for the import and visualization of transcriptomic and metabolomic data, facilitating in-depth analysis for researchers in plant biology.

Pathway Database Pathway Comparison Expression Viewer Discovery.
E N D
Presentation Transcript
Pathway DatabasePathway ComparisonExpression ViewerDiscovery. Pankaj Jaiswal Oregon State University
Pathway Home Reference Pathway databases developed by collaborators Developed by Gramene Developed by Collaborators and mirrored at Gramene
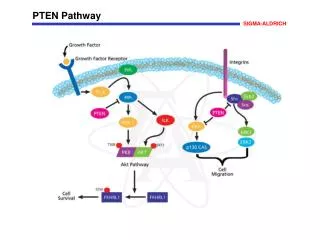
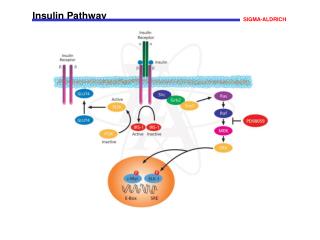
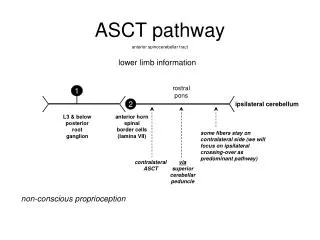
Search Example and Pathway Views Evidence Zoom upto chemical structures Metabolites and small molecules Gene product Enzyme Downstream pathways
Pathway Comparison Click to visit pathway Click to visit the reaction Click to visit the gene product
Rice KS8 Vs Ath KS1 http://www.ncbi.nlm.nih.gov/pubmed/12805613?dopt=Abstract (Fleet etal 2003.)
Beyond Pathway Views and Comparison ! Can I analyze my data live using the Pathway views?
Transcriptome Data Light Dark Light Dark 0 4 8 12 16 20 24 28 32 36 40 44 Hierarchical clustering of Arabidopsis cycling genes mapping to metabolic pathways (1753 genes). Mean centered expression levels are represented with green denoting down regulation, and red indicating upregulation. (Filichkin et al 2011 PLoS One June 2011) -500 0 500
Your sample file with expression data(tab delimited text/data file) Columns: 0 1 2 3 4 5 6 7 8 9 10 11 12 Gene/locus IDs (preferred) can be replaced by gene symbols and synonyms . ---------------------------- If the data is from metabolomics, these IDs in column-0 is replaced with the compound name/ID
Expression view on the cellular overview View data from Single data column OR Data from multiple experiments/timeline/-columns
Expression views in Pathway tool and database (local installation)
GrameneAn Alliance for Plant Biologists and Online Resources
We value your contribution and feedback.Help us improve, innovate and integrate.