Download
1 / 35
350 likes | 467 Views
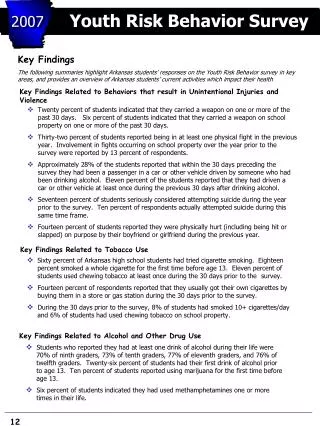
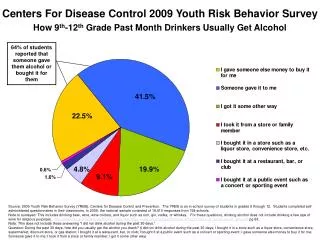
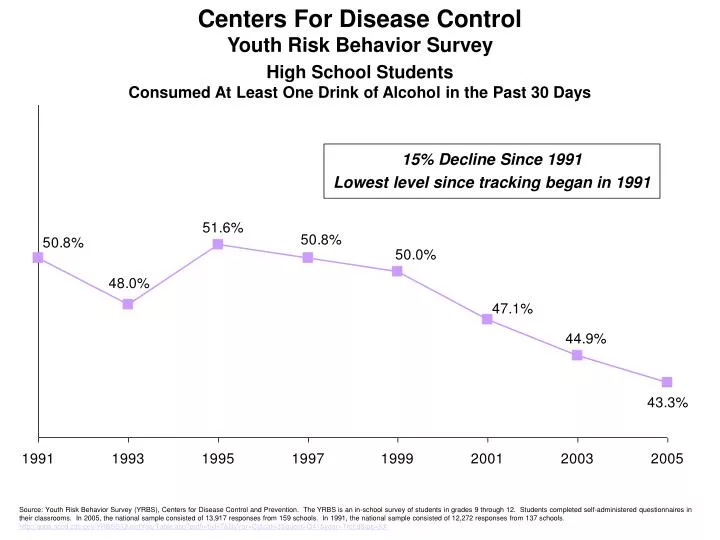
Centers For Disease Control Youth Risk Behavior Survey High School Students Consumed At Least One Drink of Alcohol in the Past 30 Days. 15% Decline Since 1991 Lowest level since tracking began in 1991.

E N D
Centers For Disease Control Youth Risk Behavior Survey High School Students Consumed At Least One Drink of Alcohol in the Past 30 Days 15% Decline Since 1991 Lowest level since tracking began in 1991 Source: Youth Risk Behavior Survey (YRBS), Centers for Disease Control and Prevention. The YRBS is an in-school survey of students in grades 9 through 12. Students completed self-administered questionnaires in their classrooms. In 2005, the national sample consisted of 13,917 responses from 159 schools. In 1991, the national sample consisted of 12,272 responses from 137 schools. http://apps.nccd.cdc.gov/YRBSS/QuestYearTable.asp?path=byHT&ByVar=CI&cat=3&quest=Q41&year=Trend&loc=XX
Centers For Disease Control Youth Risk Behavior Survey 9th Grade Students Consumed At Least One Drink of Alcohol in the Past 30 Days 11% Decline Since 1991 Source: Youth Risk Behavior Survey (YRBS), Centers for Disease Control and Prevention. The YRBS is an in-school survey of students in grades 9 through 12. Students completed self-administered questionnaires in their classrooms. In 2005, the national sample consisted of 13,917 responses from 159 schools. In 1991, the national sample consisted of 12,272 responses from 137 schools. Sample size by students: 1991 – 9th graders = 3,055, 10th graders = 3,120, 11th graders = 2,867, 12th graders = 3,209; 2005 – 9th graders =3,333, 10th graders =3,470, 11th graders =3,529, 12th graders =3,510. http://apps.nccd.cdc.gov/YRBSS/QuestYearTable.asp?cat=3&Quest=Q41&Loc=XX&Year=Trend&compval=&Graphval=no&path=byHT&loc2=&colval=All&rowval1=Grade&rowval2=None&ByVar=CI&Submit2=GO
Centers For Disease Control Youth Risk Behavior Survey 10th Grade Students Consumed At Least One Drink of Alcohol in the Past 30 Days 12% Decline Since 1991 Lowest level since tracking began in 1991 Source: Youth Risk Behavior Survey (YRBS), Centers for Disease Control and Prevention. The YRBS is an in-school survey of students in grades 9 through 12. Students completed self-administered questionnaires in their classrooms. In 2005, the national sample consisted of 13,917 responses from 159 schools. In 1991, the national sample consisted of 12,272 responses from 137 schools. Sample size by students: 1991 – 9th graders = 3,055, 10th graders = 3,120, 11th graders = 2,867, 12th graders = 3,209; 2005 – 9th graders =3,333, 10th graders =3,470, 11th graders =3,529, 12th graders =3,510. http://apps.nccd.cdc.gov/YRBSS/QuestYearTable.asp?cat=3&Quest=Q41&Loc=XX&Year=Trend&compval=&Graphval=no&path=byHT&loc2=&colval=All&rowval1=Grade&rowval2=None&ByVar=CI&Submit2=GO
Centers For Disease Control Youth Risk Behavior Survey 11th Grade Students Consumed At Least One Drink of Alcohol in the Past 30 Days 16% Decline Since 1991 Lowest level since tracking began in 1991 Source: Youth Risk Behavior Survey (YRBS), Centers for Disease Control and Prevention. The YRBS is an in-school survey of students in grades 9 through 12. Students completed self-administered questionnaires in their classrooms. In 2005, the national sample consisted of 13,917 responses from 159 schools. In 1991, the national sample consisted of 12,272 responses from 137 schools. Sample size by students: 1991 – 9th graders = 3,055, 10th graders = 3,120, 11th graders = 2,867, 12th graders = 3,209; 2005 – 9th graders =3,333, 10th graders =3,470, 11th graders =3,529, 12th graders =3,510. http://apps.nccd.cdc.gov/YRBSS/QuestYearTable.asp?cat=3&Quest=Q41&Loc=XX&Year=Trend&compval=&Graphval=no&path=byHT&loc2=&colval=All&rowval1=Grade&rowval2=None&ByVar=CI&Submit2=GO
Centers For Disease Control Youth Risk Behavior Survey 12th Grade Students Consumed At Least One Drink of Alcohol in the Past 30 Days 15% Decline Since 1991 Lowest level since tracking began in 1991 Source: Youth Risk Behavior Survey (YRBS), Centers for Disease Control and Prevention. The YRBS is an in-school survey of students in grades 9 through 12. Students completed self-administered questionnaires in their classrooms. In 2005, the national sample consisted of 13,917 responses from 159 schools. In 1991, the national sample consisted of 12,272 responses from 137 schools. Sample size by students: 1991 – 9th graders = 3,055, 10th graders = 3,120, 11th graders = 2,867, 12th graders = 3,209; 2005 – 9th graders =3,333, 10th graders =3,470, 11th graders =3,529, 12th graders =3,510. http://apps.nccd.cdc.gov/YRBSS/QuestYearTable.asp?cat=3&Quest=Q41&Loc=XX&Year=Trend&compval=&Graphval=no&path=byHT&loc2=&colval=All&rowval1=Grade&rowval2=None&ByVar=CI&Submit2=GO
Centers For Disease Control Youth Risk Behavior Survey High School Students Consumed Five or More Drinks of Alcohol in a Row in the Past 30 Days* 19% Decline Since 1991 Lowest level since tracking began in 1991 Source: Youth Risk Behavior Survey (YRBS), Centers for Disease Control and Prevention. The YRBS is an in-school survey of students in grades 9 through 12. Students completed self-administered questionnaires in their classrooms. In 2005, the national sample consisted of 13,917 responses from 159 schools. In 1991, the national sample consisted of 12,272 responses from 137 schools. http://apps.nccd.cdc.gov/YRBSS/QuestYearTable.asp?path=byHT&ByVar=CI&cat=3&quest=Q42&year=Trend&loc=XX *“in a row, that is, within a couple of hours on one or more of the past 30 days.”
Centers For Disease Control Youth Risk Behavior Survey 9th Grade Students Consumed Five or More Drinks of Alcohol in a Row in the Past 30 Days* 16% Decline Since 1991 Lowest level since tracking began in 1991 Source: Youth Risk Behavior Survey (YRBS), Centers for Disease Control and Prevention. The YRBS is an in-school survey of students in grades 9 through 12. Students completed self-administered questionnaires in their classrooms. In 2005, the national sample consisted of 13,917 responses from 159 schools. In 1991, the national sample consisted of 12,272 responses from 137 schools. Sample size by students: 1991 – 9th graders = 3,055, 10th graders = 3,120, 11th graders = 2,867, 12th graders = 3,209; 2005 – 9th graders =3,333, 10th graders =3,470, 11th graders =3,529, 12th graders =3,510. http://apps.nccd.cdc.gov/YRBSS/QuestYearTable.asp?cat=3&Quest=Q42&Loc=XX&Year=Trend&compval=&Graphval=no&path=byHT&loc2=&colval=All&rowval1=Grade&rowval2=None&ByVar=CI&Submit2=GO *“in a row, that is, within a couple of hours on one or more of the past 30 days.”
Centers For Disease Control Youth Risk Behavior Survey 10th Grade Students Consumed Five or More Drinks of Alcohol in a Row in the Past 30 Days* 9% Decline Since 1991 Lowest level since tracking began in 1991 Source: Youth Risk Behavior Survey (YRBS), Centers for Disease Control and Prevention. The YRBS is an in-school survey of students in grades 9 through 12. Students completed self-administered questionnaires in their classrooms. In 2005, the national sample consisted of 13,917 responses from 159 schools. In 1991, the national sample consisted of 12,272 responses from 137 schools. Sample size by students: 1991 – 9th graders = 3,055, 10th graders = 3,120, 11th graders = 2,867, 12th graders = 3,209; 2005 – 9th graders =3,333, 10th graders =3,470, 11th graders =3,529, 12th graders =3,510. http://apps.nccd.cdc.gov/YRBSS/QuestYearTable.asp?cat=3&Quest=Q42&Loc=XX&Year=Trend&compval=&Graphval=no&path=byHT&loc2=&colval=All&rowval1=Grade&rowval2=None&ByVar=CI&Submit2=GO *“in a row, that is, within a couple of hours on one or more of the past 30 days.”
Centers For Disease Control Youth Risk Behavior Survey 11th Grade Students Consumed Five or More Drinks of Alcohol in a Row in the Past 30 Days* 24% Decline Since 1991 Lowest level since tracking began in 1991 Source: Youth Risk Behavior Survey (YRBS), Centers for Disease Control and Prevention. The YRBS is an in-school survey of students in grades 9 through 12. Students completed self-administered questionnaires in their classrooms. In 2005, the national sample consisted of 13,917 responses from 159 schools. In 1991, the national sample consisted of 12,272 responses from 137 schools. Sample size by students: 1991 – 9th graders = 3,055, 10th graders = 3,120, 11th graders = 2,867, 12th graders = 3,209; 2005 – 9th graders =3,333, 10th graders =3,470, 11th graders =3,529, 12th graders =3,510. http://apps.nccd.cdc.gov/YRBSS/QuestYearTable.asp?cat=3&Quest=Q42&Loc=XX&Year=Trend&compval=&Graphval=no&path=byHT&loc2=&colval=All&rowval1=Grade&rowval2=None&ByVar=CI&Submit2=GO *“in a row, that is, within a couple of hours on one or more of the past 30 days.”
Centers For Disease Control Youth Risk Behavior Survey 12th Grade Students Consumed Five or More Drinks of Alcohol in a Row in the Past 30 Days* 17% Decline Since 1991 Lowest level since tracking began in 1991 Source: Youth Risk Behavior Survey (YRBS), Centers for Disease Control and Prevention. The YRBS is an in-school survey of students in grades 9 through 12. Students completed self-administered questionnaires in their classrooms. In 2005, the national sample consisted of 13,917 responses from 159 schools. In 1991, the national sample consisted of 12,272 responses from 137 schools. Sample size by students: 1991 – 9th graders = 3,055, 10th graders = 3,120, 11th graders = 2,867, 12th graders = 3,209; 2005 – 9th graders =3,333, 10th graders =3,470, 11th graders =3,529, 12th graders =3,510. http://apps.nccd.cdc.gov/YRBSS/QuestYearTable.asp?cat=3&Quest=Q42&Loc=XX&Year=Trend&compval=&Graphval=no&path=byHT&loc2=&colval=All&rowval1=Grade&rowval2=None&ByVar=CI&Submit2=GO *“in a row, that is, within a couple of hours on one or more of the past 30 days.”
Centers For Disease Control Youth Risk Behavior Survey High School Students Students Who Had Their First Drink of Alcohol Other Than a Few Sips Before Age 13 22% Decline Since 1991 Lowest level since tracking began in 1991 Source: Youth Risk Behavior Survey (YRBS), Centers for Disease Control and Prevention. The YRBS is an in-school survey of students in grades 9 through 12. Students completed self-administered questionnaires in their classrooms. In 2005, the national sample consisted of 13,917 responses from 159 schools. In 1991, the national sample consisted of 12,272 responses from 137 schools. http://apps.nccd.cdc.gov/YRBSS/QuestYearTable.asp?path=byHT&ByVar=CI&cat=3&quest=Q40&year=Trend&loc=XX
Centers For Disease Control Youth Risk Behavior Survey 9th Grade Students Students Who Had Their First Drink of Alcohol Other Than a Few Sips Before Age 13 21% Decline Since 1991 Lowest level since tracking began in 1991 Source: Youth Risk Behavior Survey (YRBS), Centers for Disease Control and Prevention. The YRBS is an in-school survey of students in grades 9 through 12. Students completed self-administered questionnaires in their classrooms. In 2005, the national sample consisted of 13,917 responses from 159 schools. In 1991, the national sample consisted of 12,272 responses from 137 schools. Sample size by students: 1991 – 9th graders = 3,055, 10th graders = 3,120, 11th graders = 2,867, 12th graders = 3,209; 2005 – 9th graders =3,333, 10th graders =3,470, 11th graders =3,529, 12th graders =3,510. http://apps.nccd.cdc.gov/YRBSS/QuestYearTable.asp?cat=3&Quest=Q40&Loc=XX&Year=Trend&compval=&Graphval=no&path=byHT&loc2=&colval=All&rowval1=Grade&rowval2=None&ByVar=CI&Submit2=GO
Centers For Disease Control Youth Risk Behavior Survey 10th Grade Students Students Who Had Their First Drink of Alcohol Other Than a Few Sips Before Age 13 21% Decline Since 1991 Lowest level since tracking began in 1991 Source: Youth Risk Behavior Survey (YRBS), Centers for Disease Control and Prevention. The YRBS is an in-school survey of students in grades 9 through 12. Students completed self-administered questionnaires in their classrooms. In 2005, the national sample consisted of 13,917 responses from 159 schools. In 1991, the national sample consisted of 12,272 responses from 137 schools. Sample size by students: 1991 – 9th graders = 3,055, 10th graders = 3,120, 11th graders = 2,867, 12th graders = 3,209; 2005 – 9th graders =3,333, 10th graders =3,470, 11th graders =3,529, 12th graders =3,510. http://apps.nccd.cdc.gov/YRBSS/QuestYearTable.asp?cat=3&Quest=Q40&Loc=XX&Year=Trend&compval=&Graphval=no&path=byHT&loc2=&colval=All&rowval1=Grade&rowval2=None&ByVar=CI&Submit2=GO
Centers For Disease Control Youth Risk Behavior Survey 11th Grade Students Students Who Had Their First Drink of Alcohol Other Than a Few Sips Before Age 13 32% Decline Since 1991 Lowest level since tracking began in 1991 Source: Youth Risk Behavior Survey (YRBS), Centers for Disease Control and Prevention. The YRBS is an in-school survey of students in grades 9 through 12. Students completed self-administered questionnaires in their classrooms. In 2005, the national sample consisted of 13,917 responses from 159 schools. In 1991, the national sample consisted of 12,272 responses from 137 schools. Sample size by students: 1991 – 9th graders = 3,055, 10th graders = 3,120, 11th graders = 2,867, 12th graders = 3,209; 2005 – 9th graders =3,333, 10th graders =3,470, 11th graders =3,529, 12th graders =3,510. http://apps.nccd.cdc.gov/YRBSS/QuestYearTable.asp?cat=3&Quest=Q40&Loc=XX&Year=Trend&compval=&Graphval=no&path=byHT&loc2=&colval=All&rowval1=Grade&rowval2=None&ByVar=CI&Submit2=GO
Centers For Disease Control Youth Risk Behavior Survey 12th Grade Students Students Who Had Their First Drink of Alcohol Other Than a Few Sips Before Age 13 24% Decline Since 1991 Lowest level since tracking began in 1991 Source: Youth Risk Behavior Survey (YRBS), Centers for Disease Control and Prevention. The YRBS is an in-school survey of students in grades 9 through 12. Students completed self-administered questionnaires in their classrooms. In 2005, the national sample consisted of 13,917 responses from 159 schools. In 1991, the national sample consisted of 12,272 responses from 137 schools. Sample size by students: 1991 – 9th graders = 3,055, 10th graders = 3,120, 11th graders = 2,867, 12th graders = 3,209; 2005 – 9th graders =3,333, 10th graders =3,470, 11th graders =3,529, 12th graders =3,510. http://apps.nccd.cdc.gov/YRBSS/QuestYearTable.asp?cat=3&Quest=Q40&Loc=XX&Year=Trend&compval=&Graphval=no&path=byHT&loc2=&colval=All&rowval1=Grade&rowval2=None&ByVar=CI&Submit2=GO
Centers For Disease Control Youth Risk Behavior Survey High School Students Consumed At Least One Drink of Alcohol on One or More Days During Their Life 9% Decline Since 1991 Lowest level since tracking began in 1991 Source: Youth Risk Behavior Survey (YRBS), Centers for Disease Control and Prevention. The YRBS is an in-school survey of students in grades 9 through 12. Students completed self-administered questionnaires in their classrooms. In 2005, the national sample consisted of 13,917 responses from 159 schools. In 1991, the national sample consisted of 12,272 responses from 137 schools. http://apps.nccd.cdc.gov/YRBSS/QuestYearTable.asp?path=byHT&ByVar=CI&cat=3&quest=Q39&year=Trend&loc=XX
Centers For Disease Control Youth Risk Behavior Survey 9th Grade Students Consumed At Least One Drink of Alcohol on One or More Days During Their Life 7% Decline Since 1991 Source: Youth Risk Behavior Survey (YRBS), Centers for Disease Control and Prevention. The YRBS is an in-school survey of students in grades 9 through 12. Students completed self-administered questionnaires in their classrooms. In 2005, the national sample consisted of 13,917 responses from 159 schools. In 1991, the national sample consisted of 12,272 responses from 137 schools. Sample size by students: 1991 – 9th graders = 3,055, 10th graders = 3,120, 11th graders = 2,867, 12th graders = 3,209; 2005 – 9th graders =3,333, 10th graders =3,470, 11th graders =3,529, 12th graders =3,510. http://apps.nccd.cdc.gov/YRBSS/QuestYearTable.asp?cat=3&Quest=Q39&Loc=XX&Year=Trend&compval=&Graphval=no&path=byHT&loc2=&colval=All&rowval1=Grade&rowval2=None&ByVar=CI&Submit2=GO
Centers For Disease Control Youth Risk Behavior Survey 10th Grade Students Consumed At Least One Drink of Alcohol on One or More Days During Their Life 7% Decline Since 1991 Lowest level since tracking began in 1991 Source: Youth Risk Behavior Survey (YRBS), Centers for Disease Control and Prevention. The YRBS is an in-school survey of students in grades 9 through 12. Students completed self-administered questionnaires in their classrooms. In 2005, the national sample consisted of 13,917 responses from 159 schools. In 1991, the national sample consisted of 12,272 responses from 137 schools. Sample size by students: 1991 – 9th graders = 3,055, 10th graders = 3,120, 11th graders = 2,867, 12th graders = 3,209; 2005 – 9th graders =3,333, 10th graders =3,470, 11th graders =3,529, 12th graders =3,510. http://apps.nccd.cdc.gov/YRBSS/QuestYearTable.asp?cat=3&Quest=Q39&Loc=XX&Year=Trend&compval=&Graphval=no&path=byHT&loc2=&colval=All&rowval1=Grade&rowval2=None&ByVar=CI&Submit2=GO
Centers For Disease Control Youth Risk Behavior Survey 11th Grade Students Consumed At Least One Drink of Alcohol on One or More Days During Their Life 12% Decline Since 1991 Lowest level since tracking began in 1991 Source: Youth Risk Behavior Survey (YRBS), Centers for Disease Control and Prevention. The YRBS is an in-school survey of students in grades 9 through 12. Students completed self-administered questionnaires in their classrooms. In 2005, the national sample consisted of 13,917 responses from 159 schools. In 1991, the national sample consisted of 12,272 responses from 137 schools. Sample size by students: 1991 – 9th graders = 3,055, 10th graders = 3,120, 11th graders = 2,867, 12th graders = 3,209; 2005 – 9th graders =3,333, 10th graders =3,470, 11th graders =3,529, 12th graders =3,510. http://apps.nccd.cdc.gov/YRBSS/QuestYearTable.asp?cat=3&Quest=Q39&Loc=XX&Year=Trend&compval=&Graphval=no&path=byHT&loc2=&colval=All&rowval1=Grade&rowval2=None&ByVar=CI&Submit2=GO
Centers For Disease Control Youth Risk Behavior Survey 12th Grade Students Consumed At Least One Drink of Alcohol on One or More Days During Their Life 6% Decline Since 1991 Lowest level since tracking began in 1991 Source: Youth Risk Behavior Survey (YRBS), Centers for Disease Control and Prevention. The YRBS is an in-school survey of students in grades 9 through 12. Students completed self-administered questionnaires in their classrooms. In 2005, the national sample consisted of 13,917 responses from 159 schools. In 1991, the national sample consisted of 12,272 responses from 137 schools. Sample size by students: 1991 – 9th graders = 3,055, 10th graders = 3,120, 11th graders = 2,867, 12th graders = 3,209; 2005 – 9th graders =3,333, 10th graders =3,470, 11th graders =3,529, 12th graders =3,510. http://apps.nccd.cdc.gov/YRBSS/QuestYearTable.asp?cat=3&Quest=Q39&Loc=XX&Year=Trend&compval=&Graphval=no&path=byHT&loc2=&colval=All&rowval1=Grade&rowval2=None&ByVar=CI&Submit2=GO
Centers For Disease Control Youth Risk Behavior Survey High School Students Consumed At Least One Drink of Alcohol on School Property in the Past 30 days 17% Decline Since 1993 Lowest level since tracking began in 1993 Source: Youth Risk Behavior Survey (YRBS), Centers for Disease Control and Prevention. The YRBS is an in-school survey of students in grades 9 through 12. Students completed self-administered questionnaires in their classrooms. In 2005, the national sample consisted of 13,917 responses from 159 schools. In 1991, the national sample consisted of 12,272 responses from 137 schools. http://apps.nccd.cdc.gov/YRBSS/QuestYearTable.asp?path=byHT&ByVar=CI&cat=3&quest=Q43&year=Trend&loc=XX
Centers For Disease Control Youth Risk Behavior Survey 9th Grade Students Consumed At Least One Drink of Alcohol on School Property in the Past 30 days 29% Decline Since 1993 Lowest level since tracking began in 1993 Source: Youth Risk Behavior Survey (YRBS), Centers for Disease Control and Prevention. The YRBS is an in-school survey of students in grades 9 through 12. Students completed self-administered questionnaires in their classrooms. In 2005, the national sample consisted of 13,917 responses from 159 schools. In 1991, the national sample consisted of 12,272 responses from 137 schools. Sample size by students: 1993 – 9th graders =, 10th graders =, 11th graders =, 12th graders =; 2005 – 9th graders =3,333, 10th graders =3,470, 11th graders =3,529, 12th graders =3,510. http://apps.nccd.cdc.gov/YRBSS/QuestYearTable.asp?cat=3&Quest=Q43&Loc=XX&Year=Trend&compval=&Graphval=no&path=byHT&loc2=&colval=All&rowval1=Grade&rowval2=None&ByVar=CI&Submit2=GO
Centers For Disease Control Youth Risk Behavior Survey 10th Grade Students Consumed At Least One Drink of Alcohol on School Property in the Past 30 days 4% Decline Since 1993 Lowest level since tracking began in 1993 Source: Youth Risk Behavior Survey (YRBS), Centers for Disease Control and Prevention. The YRBS is an in-school survey of students in grades 9 through 12. Students completed self-administered questionnaires in their classrooms. In 2005, the national sample consisted of 13,917 responses from 159 schools. In 1991, the national sample consisted of 12,272 responses from 137 schools. Sample size by students: 1993 – 9th graders =, 10th graders =, 11th graders =, 12th graders =; 2005 – 9th graders =3,333, 10th graders =3,470, 11th graders =3,529, 12th graders =3,510. http://apps.nccd.cdc.gov/YRBSS/QuestYearTable.asp?cat=3&Quest=Q43&Loc=XX&Year=Trend&compval=&Graphval=no&path=byHT&loc2=&colval=All&rowval1=Grade&rowval2=None&ByVar=CI&Submit2=GO
Centers For Disease Control Youth Risk Behavior Survey 11th Grade Students Consumed At Least One Drink of Alcohol on School Property in the Past 30 days 23% Decline Since 1993 Lowest level since tracking began in 1993 Source: Youth Risk Behavior Survey (YRBS), Centers for Disease Control and Prevention. The YRBS is an in-school survey of students in grades 9 through 12. Students completed self-administered questionnaires in their classrooms. In 2005, the national sample consisted of 13,917 responses from 159 schools. In 1991, the national sample consisted of 12,272 responses from 137 schools. Sample size by students: 1993 – 9th graders =, 10th graders =, 11th graders =, 12th graders =; 2005 – 9th graders =3,333, 10th graders =3,470, 11th graders =3,529, 12th graders =3,510. http://apps.nccd.cdc.gov/YRBSS/QuestYearTable.asp?cat=3&Quest=Q43&Loc=XX&Year=Trend&compval=&Graphval=no&path=byHT&loc2=&colval=All&rowval1=Grade&rowval2=None&ByVar=CI&Submit2=GO
Centers For Disease Control Youth Risk Behavior Survey 12th Grade Students Consumed At Least One Drink of Alcohol on School Property in the Past 30 days 13% Decline Since 1993 Source: Youth Risk Behavior Survey (YRBS), Centers for Disease Control and Prevention. The YRBS is an in-school survey of students in grades 9 through 12. Students completed self-administered questionnaires in their classrooms. In 2005, the national sample consisted of 13,917 responses from 159 schools. In 1991, the national sample consisted of 12,272 responses from 137 schools. Sample size by students: 1993 – 9th graders =, 10th graders =, 11th graders =, 12th graders =; 2005 – 9th graders =3,333, 10th graders =3,470, 11th graders =3,529, 12th graders =3,510. http://apps.nccd.cdc.gov/YRBSS/QuestYearTable.asp?cat=3&Quest=Q43&Loc=XX&Year=Trend&compval=&Graphval=no&path=byHT&loc2=&colval=All&rowval1=Grade&rowval2=None&ByVar=CI&Submit2=GO
Centers For Disease Control Youth Risk Behavior Survey High School Students Rode In A Car Driven By Someone Who Had Been Drinking (Past 30 Days) 29% Decline Since 1991 Lowest level since tracking began in 1991 Source: Youth Risk Behavior Survey (YRBS), Centers for Disease Control and Prevention. The YRBS is an in-school survey of students in grades 9 through 12. Students completed self-administered questionnaires in their classrooms. In 2005, the national sample consisted of 13,917 responses from 159 schools. In 1991, the national sample consisted of 12,272 responses from 137 schools. http://apps.nccd.cdc.gov/YRBSS/QuestYearTable.asp?cat=1&Quest=Q10&Loc=XX&Year=Trend&compval=&Graphval=no&path=byHT&loc2=&colval=All&rowval1=Grade&rowval2=None&ByVar=CI&Submit2=GO Question: During the past 30 days, how many times did you ride in a car or other vehicle driven by someone who had been drinking alcohol? 0 times, 1 time, 2 or 3 times, 4 or 5 times, 6 or more times
Centers For Disease Control Youth Risk Behavior Survey 9th Grade Students Rode In A Car Driven By Someone Who Had Been Drinking (Past 30 Days) 20% Decline Since 1991 Lowest level since tracking began in 1991 Source: Youth Risk Behavior Survey (YRBS), Centers for Disease Control and Prevention. The YRBS is an in-school survey of students in grades 9 through 12. Students completed self-administered questionnaires in their classrooms. In 2005, the national sample consisted of 13,917 responses from 159 schools. In 1991, the national sample consisted of 12,272 responses from 137 schools. Sample size by students: 1991 – 9th graders = 3,055, 10th graders = 3,120, 11th graders = 2,867, 12th graders = 3,209; 2005 – 9th graders =3,333, 10th graders =3,470, 11th graders =3,529, 12th graders =3,510. http://apps.nccd.cdc.gov/YRBSS/QuestYearTable.asp?cat=1&Quest=Q10&Loc=XX&Year=Trend&compval=&Graphval=no&path=byHT&loc2=&colval=All&rowval1=Grade&rowval2=None&ByVar=CI&Submit2=GO Question: During the past 30 days, how many times did you ride in a car or other vehicle driven by someone who had been drinking alcohol? 0 times, 1 time, 2 or 3 times, 4 or 5 times, 6 or more times
Centers For Disease Control Youth Risk Behavior Survey 10th Grade Students Rode In A Car Driven By Someone Who Had Been Drinking (Past 30 Days) 26% Decline Since 1991 Lowest level since tracking began in 1991 Source: Youth Risk Behavior Survey (YRBS), Centers for Disease Control and Prevention. The YRBS is an in-school survey of students in grades 9 through 12. Students completed self-administered questionnaires in their classrooms. In 2005, the national sample consisted of 13,917 responses from 159 schools. In 1991, the national sample consisted of 12,272 responses from 137 schools. Sample size by students: 1991 – 9th graders = 3,055, 10th graders = 3,120, 11th graders = 2,867, 12th graders = 3,209; 2005 – 9th graders =3,333, 10th graders =3,470, 11th graders =3,529, 12th graders =3,510. http://apps.nccd.cdc.gov/YRBSS/QuestYearTable.asp?cat=1&Quest=Q10&Loc=XX&Year=Trend&compval=&Graphval=no&path=byHT&loc2=&colval=All&rowval1=Grade&rowval2=None&ByVar=CI&Submit2=GO Question: During the past 30 days, how many times did you ride in a car or other vehicle driven by someone who had been drinking alcohol? 0 times, 1 time, 2 or 3 times, 4 or 5 times, 6 or more times
Centers For Disease Control Youth Risk Behavior Survey 11th Grade Students Rode In A Car Driven By Someone Who Had Been Drinking (Past 30 Days) 34% Decline Since 1991 Lowest level since tracking began in 1991 Source: Youth Risk Behavior Survey (YRBS), Centers for Disease Control and Prevention. The YRBS is an in-school survey of students in grades 9 through 12. Students completed self-administered questionnaires in their classrooms. In 2005, the national sample consisted of 13,917 responses from 159 schools. In 1991, the national sample consisted of 12,272 responses from 137 schools. Sample size by students: 1991 – 9th graders = 3,055, 10th graders = 3,120, 11th graders = 2,867, 12th graders = 3,209; 2005 – 9th graders =3,333, 10th graders =3,470, 11th graders =3,529, 12th graders =3,510. http://apps.nccd.cdc.gov/YRBSS/QuestYearTable.asp?cat=1&Quest=Q10&Loc=XX&Year=Trend&compval=&Graphval=no&path=byHT&loc2=&colval=All&rowval1=Grade&rowval2=None&ByVar=CI&Submit2=GO Question: During the past 30 days, how many times did you ride in a car or other vehicle driven by someone who had been drinking alcohol? 0 times, 1 time, 2 or 3 times, 4 or 5 times, 6 or more times
Centers For Disease Control Youth Risk Behavior Survey 12th Grade Students Rode In A Car Driven By Someone Who Had Been Drinking (Past 30 Days) 33% Decline Since 1991 Lowest level since tracking began in 1991 Source: Youth Risk Behavior Survey (YRBS), Centers for Disease Control and Prevention. The YRBS is an in-school survey of students in grades 9 through 12. Students completed self-administered questionnaires in their classrooms. In 2005, the national sample consisted of 13,917 responses from 159 schools. In 1991, the national sample consisted of 12,272 responses from 137 schools. Sample size by students: 1991 – 9th graders = 3,055, 10th graders = 3,120, 11th graders = 2,867, 12th graders = 3,209; 2005 – 9th graders =3,333, 10th graders =3,470, 11th graders =3,529, 12th graders =3,510. http://apps.nccd.cdc.gov/YRBSS/QuestYearTable.asp?cat=1&Quest=Q10&Loc=XX&Year=Trend&compval=&Graphval=no&path=byHT&loc2=&colval=All&rowval1=Grade&rowval2=None&ByVar=CI&Submit2=GO Question: During the past 30 days, how many times did you ride in a car or other vehicle driven by someone who had been drinking alcohol? 0 times, 1 time, 2 or 3 times, 4 or 5 times, 6 or more times
Centers For Disease Control Youth Risk Behavior Survey High School Students Drove A Car Driven When They Had Been Drinking (Past 30 Days) 41% Decline Since 1991 Lowest level since tracking began in 1991 Source: Youth Risk Behavior Survey (YRBS), Centers for Disease Control and Prevention. The YRBS is an in-school survey of students in grades 9 through 12. Students completed self-administered questionnaires in their classrooms. In 2005, the national sample consisted of 13,917 responses from 159 schools. In 1991, the national sample consisted of 12,272 responses from 137 schools. http://apps.nccd.cdc.gov/YRBSS/QuestYearTable.asp?cat=1&Quest=Q11&Loc=XX&Year=Trend&compval=&Graphval=no&path=byHT&loc2=&colval=All&rowval1=Grade&rowval2=None&ByVar=CI&Submit2=GO Question: During the past 30 days, how many times did you drive a car or other vehicle when you had been drinking alcohol? 0 times, 1 time, 2 or 3 times, 4 or 5 times, 6 or more times
Centers For Disease Control Youth Risk Behavior Survey 9th Grade Students Drove A Car When They Had Been Drinking (Past 30 Days) 8% Decline Since 1991 Source: Youth Risk Behavior Survey (YRBS), Centers for Disease Control and Prevention. The YRBS is an in-school survey of students in grades 9 through 12. Students completed self-administered questionnaires in their classrooms. In 2005, the national sample consisted of 13,917 responses from 159 schools. In 1991, the national sample consisted of 12,272 responses from 137 schools. Sample size by students: 1991 – 9th graders = 3,055, 10th graders = 3,120, 11th graders = 2,867, 12th graders = 3,209; 2005 – 9th graders =3,333, 10th graders =3,470, 11th graders =3,529, 12th graders =3,510. http://apps.nccd.cdc.gov/YRBSS/QuestYearTable.asp?cat=1&Quest=Q11&Loc=XX&Year=Trend&compval=&Graphval=no&path=byHT&loc2=&colval=All&rowval1=Grade&rowval2=None&ByVar=CI&Submit2=GO Question: During the past 30 days, how many times did you drive a car or other vehicle when you had been drinking alcohol? 0 times, 1 time, 2 or 3 times, 4 or 5 times, 6 or more times
Centers For Disease Control Youth Risk Behavior Survey 10th Grade Students Drove A Car When They Had Been Drinking (Past 30 Days) 45% Decline Since 1991 Lowest level since tracking began in 1991 Source: Youth Risk Behavior Survey (YRBS), Centers for Disease Control and Prevention. The YRBS is an in-school survey of students in grades 9 through 12. Students completed self-administered questionnaires in their classrooms. In 2005, the national sample consisted of 13,917 responses from 159 schools. In 1991, the national sample consisted of 12,272 responses from 137 schools. Sample size by students: 1991 – 9th graders = 3,055, 10th graders = 3,120, 11th graders = 2,867, 12th graders = 3,209; 2005 – 9th graders =3,333, 10th graders =3,470, 11th graders =3,529, 12th graders =3,510. http://apps.nccd.cdc.gov/YRBSS/QuestYearTable.asp?cat=1&Quest=Q11&Loc=XX&Year=Trend&compval=&Graphval=no&path=byHT&loc2=&colval=All&rowval1=Grade&rowval2=None&ByVar=CI&Submit2=GO Question: During the past 30 days, how many times did you drive a car or other vehicle when you had been drinking alcohol? 0 times, 1 time, 2 or 3 times, 4 or 5 times, 6 or more times
Centers For Disease Control Youth Risk Behavior Survey 11th Grade Students Drove A Car When They Had Been Drinking (Past 30 Days) 41% Decline Since 1991 Lowest level since tracking began in 1991 Source: Youth Risk Behavior Survey (YRBS), Centers for Disease Control and Prevention. The YRBS is an in-school survey of students in grades 9 through 12. Students completed self-administered questionnaires in their classrooms. In 2005, the national sample consisted of 13,917 responses from 159 schools. In 1991, the national sample consisted of 12,272 responses from 137 schools. Sample size by students: 1991 – 9th graders = 3,055, 10th graders = 3,120, 11th graders = 2,867, 12th graders = 3,209; 2005 – 9th graders =3,333, 10th graders =3,470, 11th graders =3,529, 12th graders =3,510. http://apps.nccd.cdc.gov/YRBSS/QuestYearTable.asp?cat=1&Quest=Q11&Loc=XX&Year=Trend&compval=&Graphval=no&path=byHT&loc2=&colval=All&rowval1=Grade&rowval2=None&ByVar=CI&Submit2=GO Question: During the past 30 days, how many times did you drive a car or other vehicle when you had been drinking alcohol? 0 times, 1 time, 2 or 3 times, 4 or 5 times, 6 or more times
Centers For Disease Control Youth Risk Behavior Survey 12th Grade Students Drove A Car When They Had Been Drinking (Past 30 Days) 39% Decline Since 1991 Lowest level since tracking began in 1991 Source: Youth Risk Behavior Survey (YRBS), Centers for Disease Control and Prevention. The YRBS is an in-school survey of students in grades 9 through 12. Students completed self-administered questionnaires in their classrooms. In 2005, the national sample consisted of 13,917 responses from 159 schools. In 1991, the national sample consisted of 12,272 responses from 137 schools. Sample size by students: 1991 – 9th graders = 3,055, 10th graders = 3,120, 11th graders = 2,867, 12th graders = 3,209; 2005 – 9th graders =3,333, 10th graders =3,470, 11th graders =3,529, 12th graders =3,510. http://apps.nccd.cdc.gov/YRBSS/QuestYearTable.asp?cat=1&Quest=Q11&Loc=XX&Year=Trend&compval=&Graphval=no&path=byHT&loc2=&colval=All&rowval1=Grade&rowval2=None&ByVar=CI&Submit2=GO Question: During the past 30 days, how many times did you drive a car or other vehicle when you had been drinking alcohol? 0 times, 1 time, 2 or 3 times, 4 or 5 times, 6 or more times